Blog / Release 2.32
Added display of licence limits
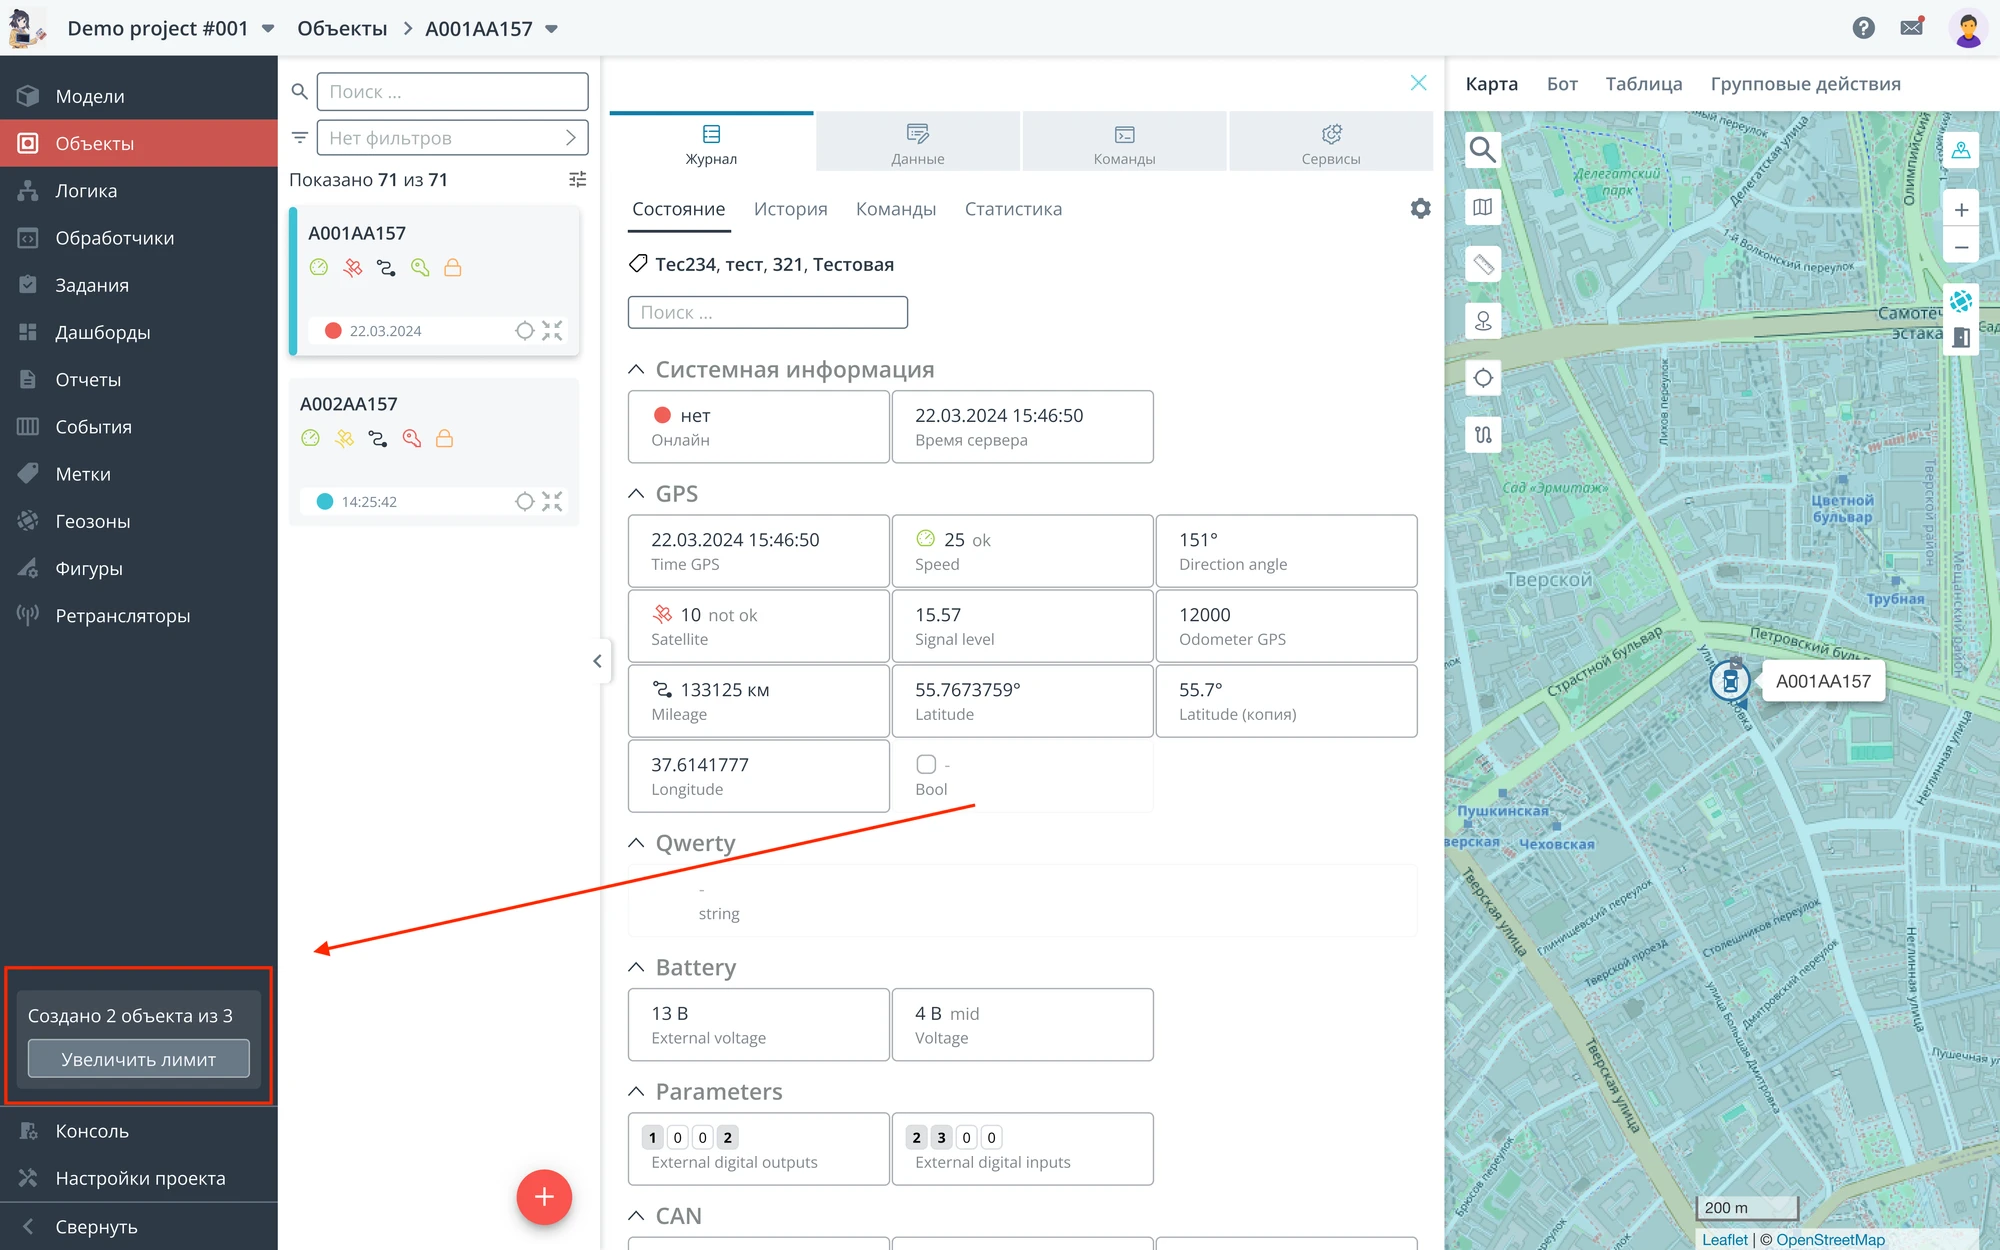
Added information about the limit of objects in your projects to the platform menu. This window appears if the number of objects in your project approaches the upper limit (75% or more). Clicking on “Increase limit” will open your profile, where you can change the licence settings.
Added a new view of data in the Object
-
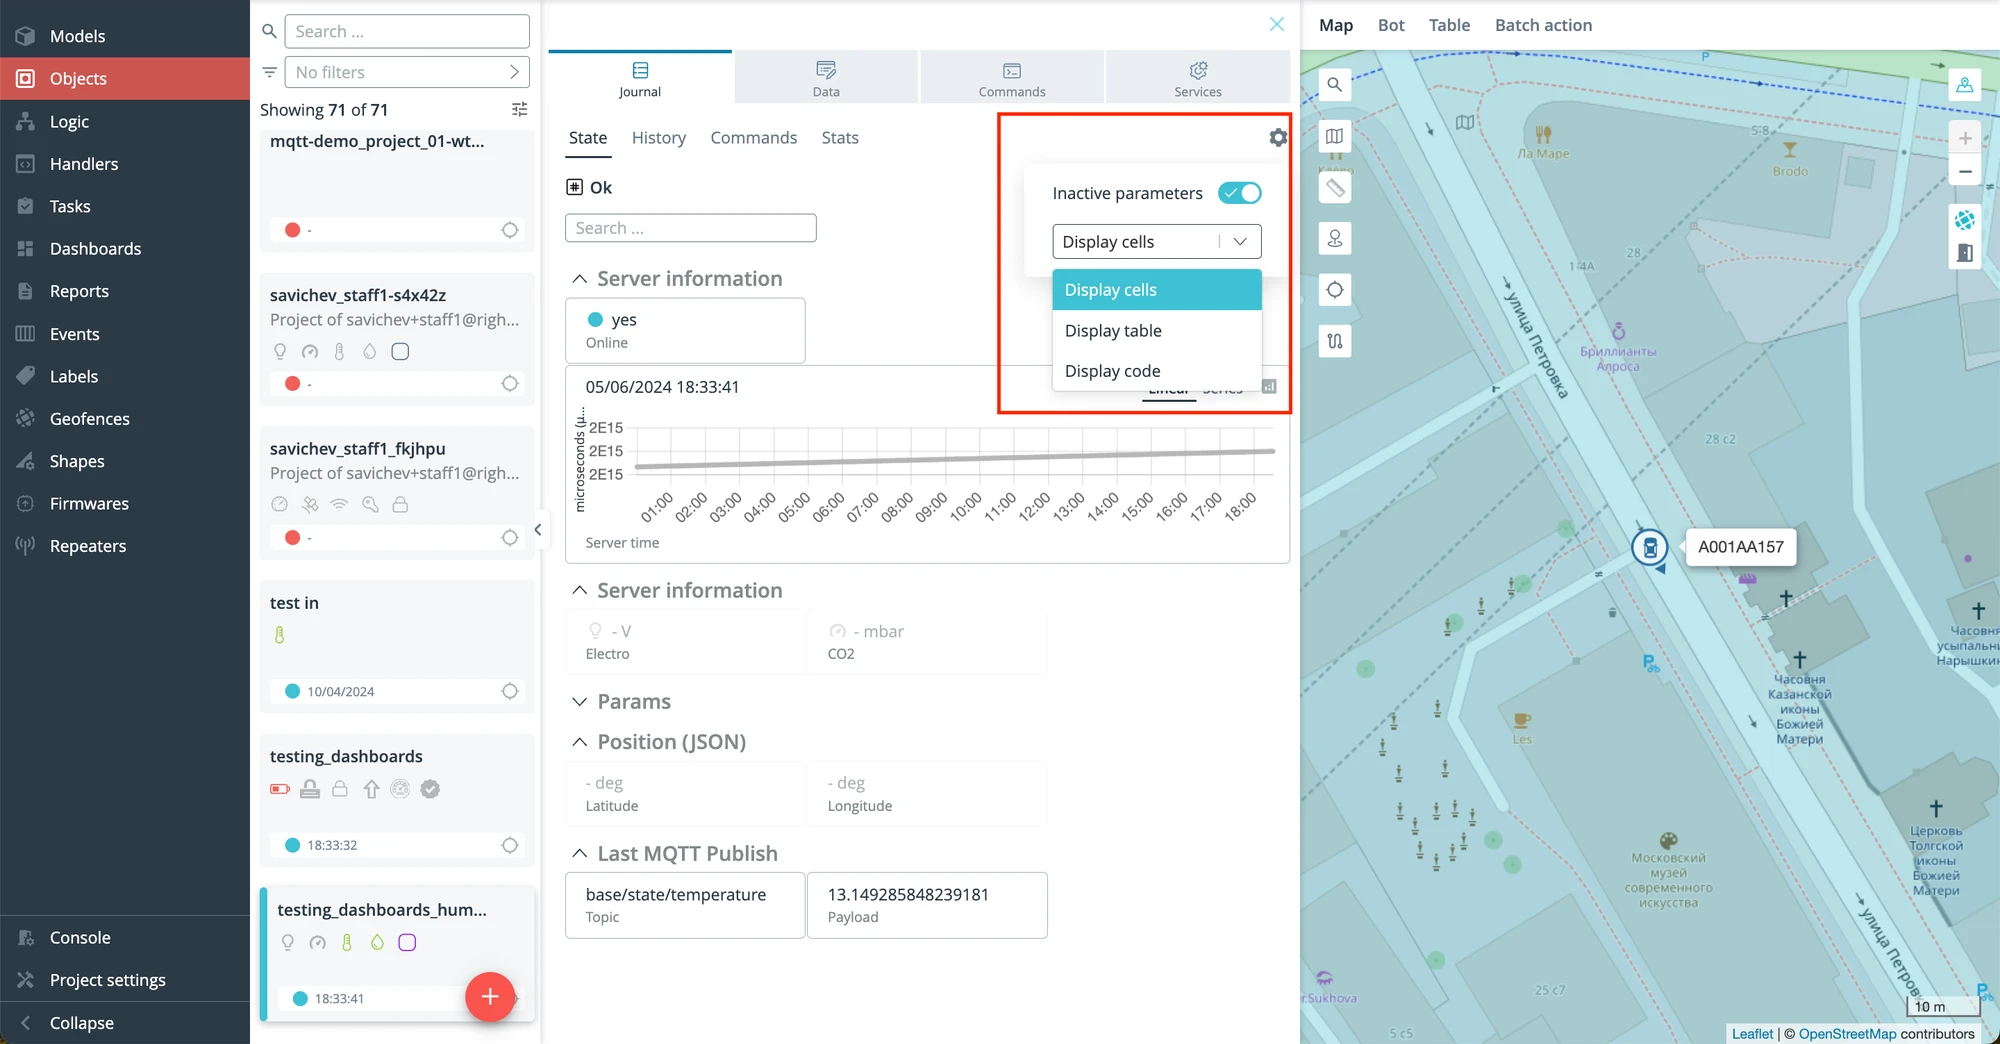
Added an additional view of data for displaying more parameters – display as a table. Selection of display type is available in the settings.
-
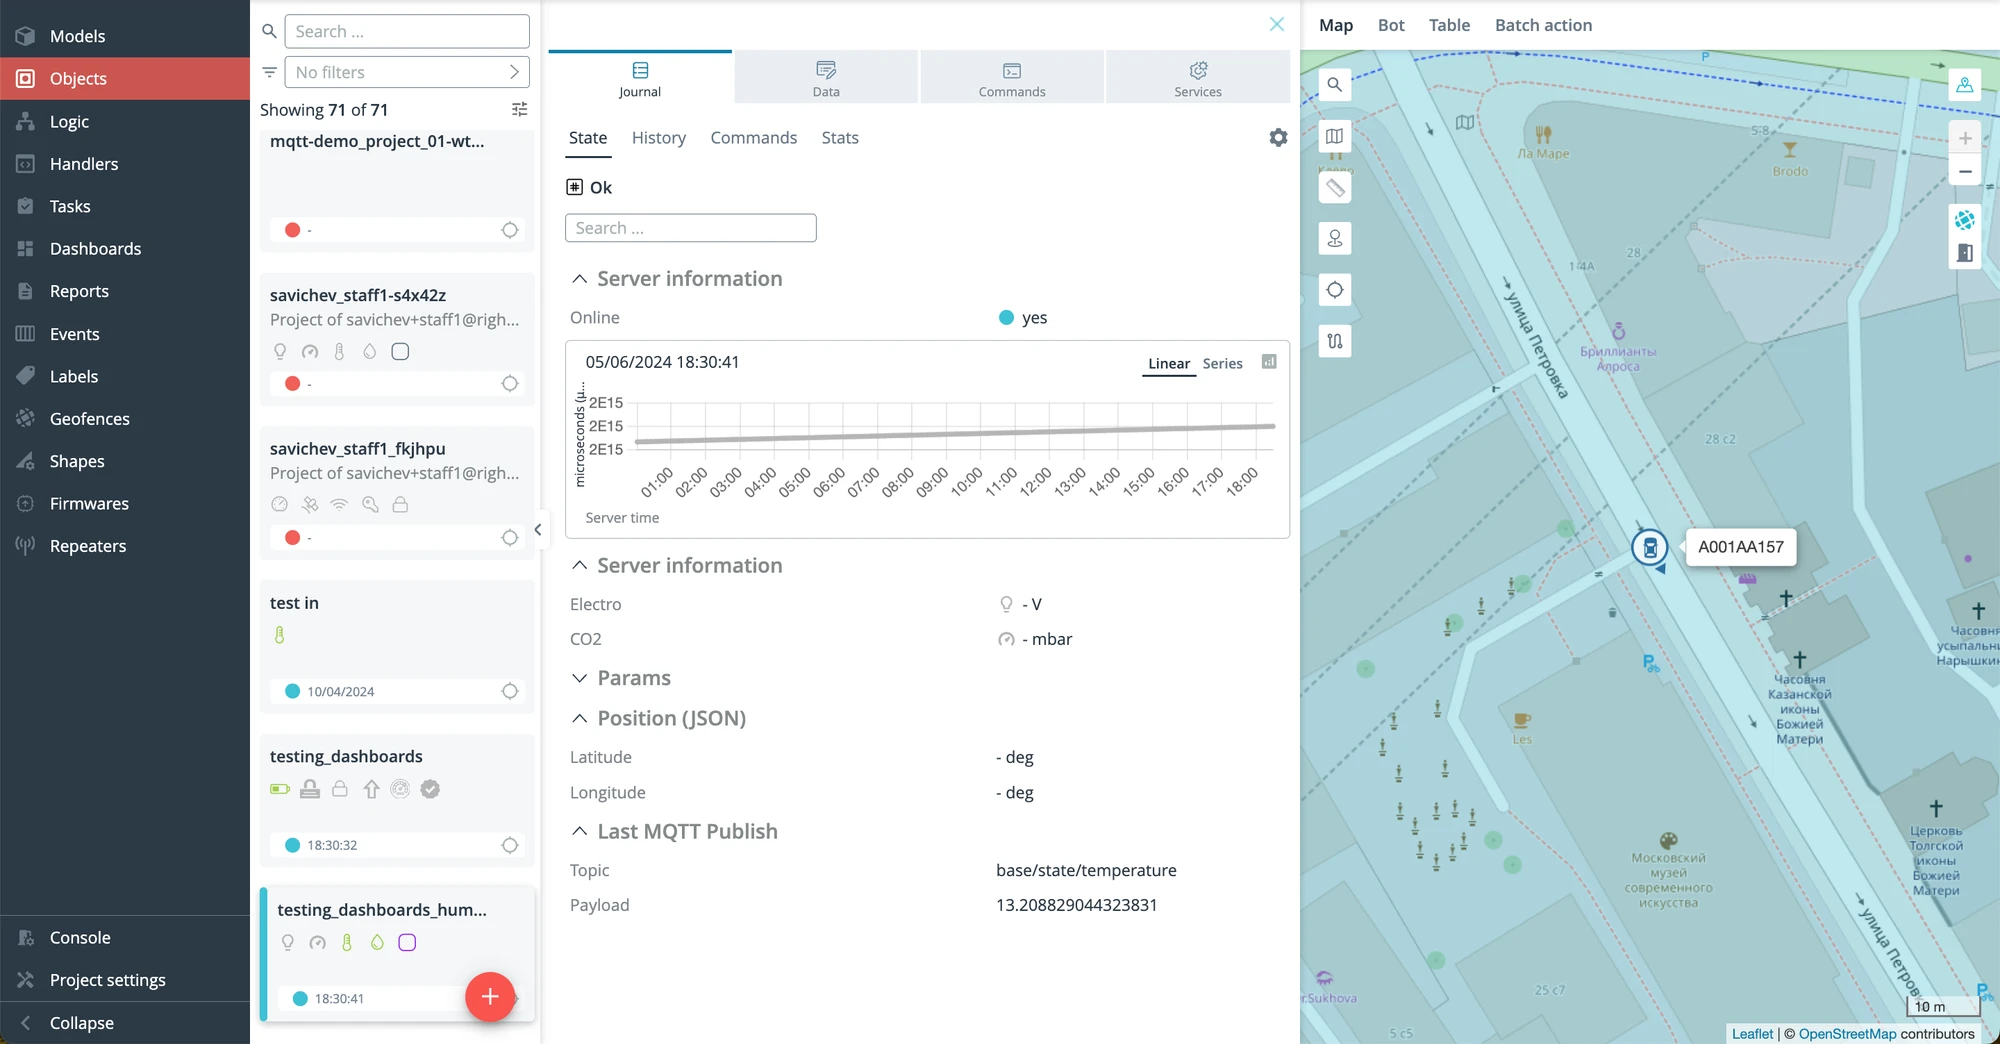
The interface type is “Display table” with a drop-down chart.
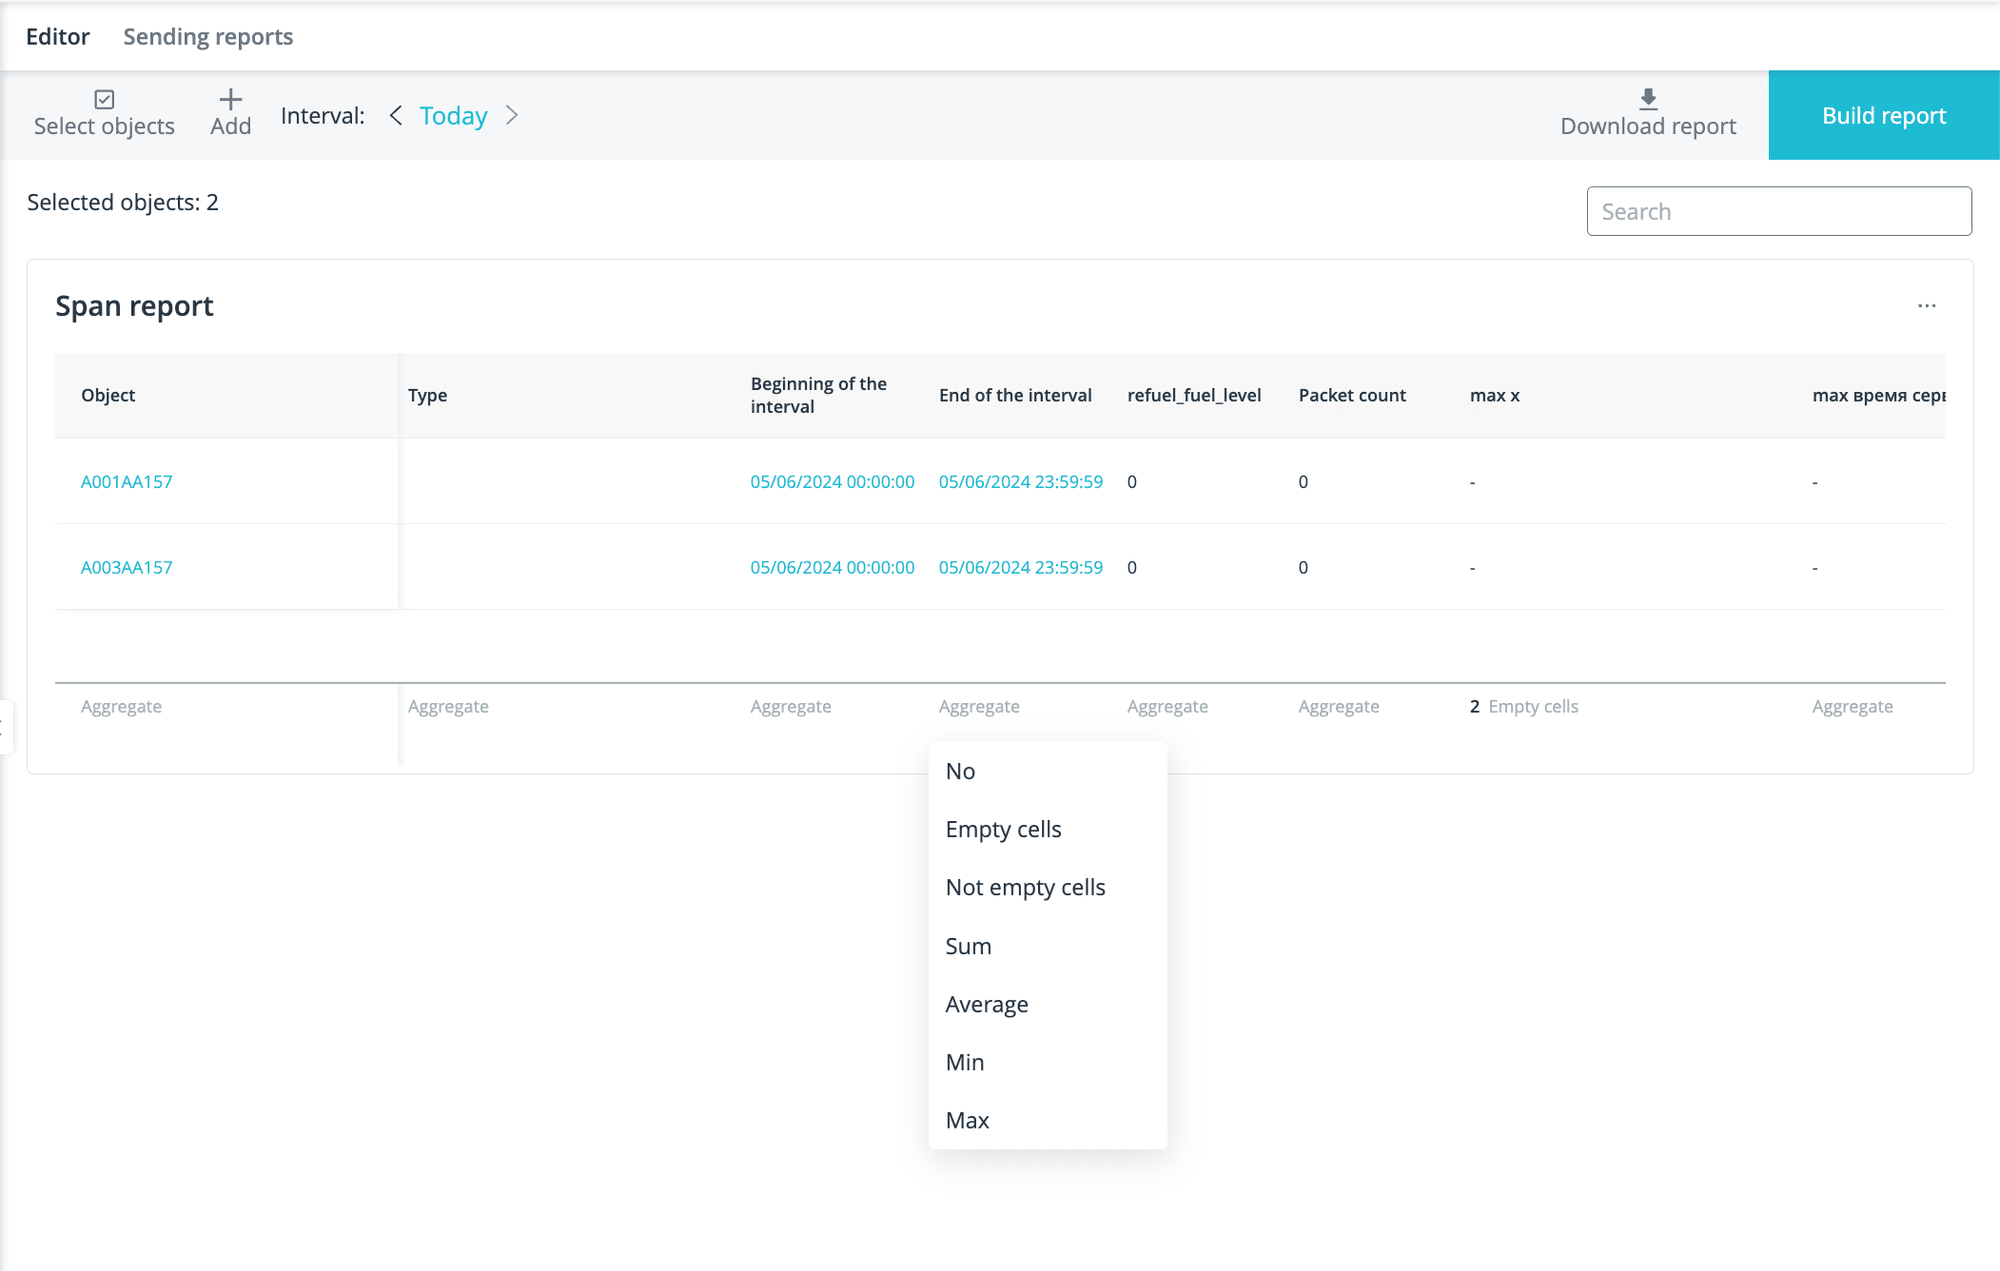
Added the ability to apply calculation functions to columns in Reports
Fields will appear at the bottom of the table where you can choose how to summarise each column individually. The list of possible options for summarising:
-
no (invisible field)
-
sum
-
average
-
maximum
-
minimum
-
empty cells
-
not empty cells
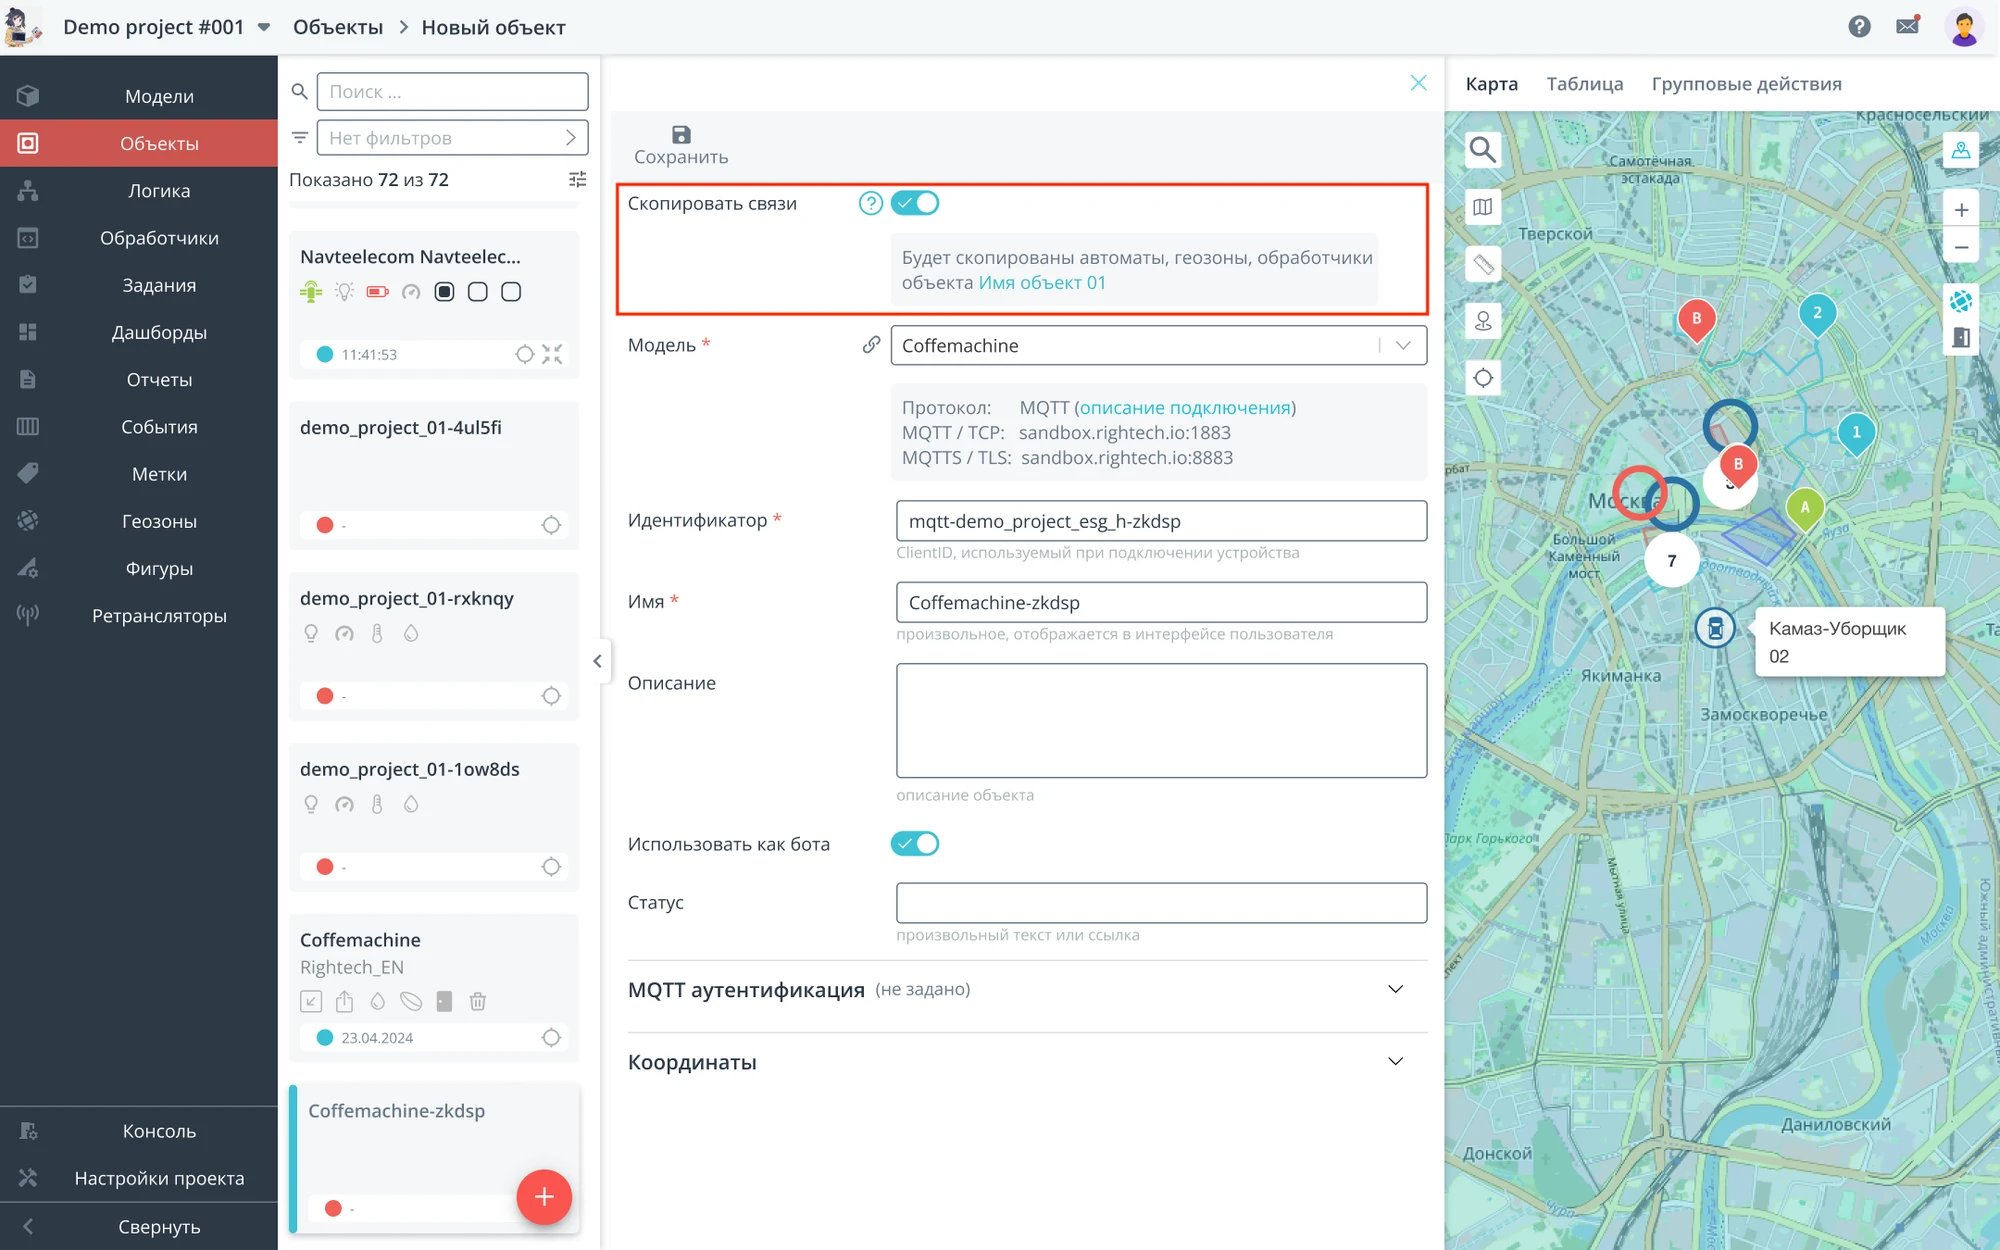
Added an opportunity to create a copy of an object with all assigned links - Logics, Geofences and Handlers
Added the ability to select a template with different entities to create an object with Logics, Geofences and Handlers. Such entities will be assigned and run automatically.
New widget settings in dashboards
-
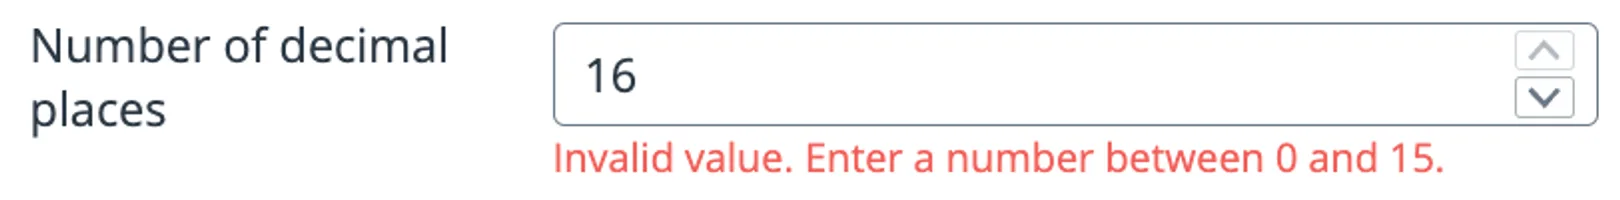
Added an input field in the display settings with the ability to select the number of decimal places (from 0 to 15) for widgets: line chart, bar chart, pie chart, speedometer, bar chart, counter.
-
Redesigned all indentations in widgets.
-
The new dashboard is updated automatically when created by importing from a file.
-
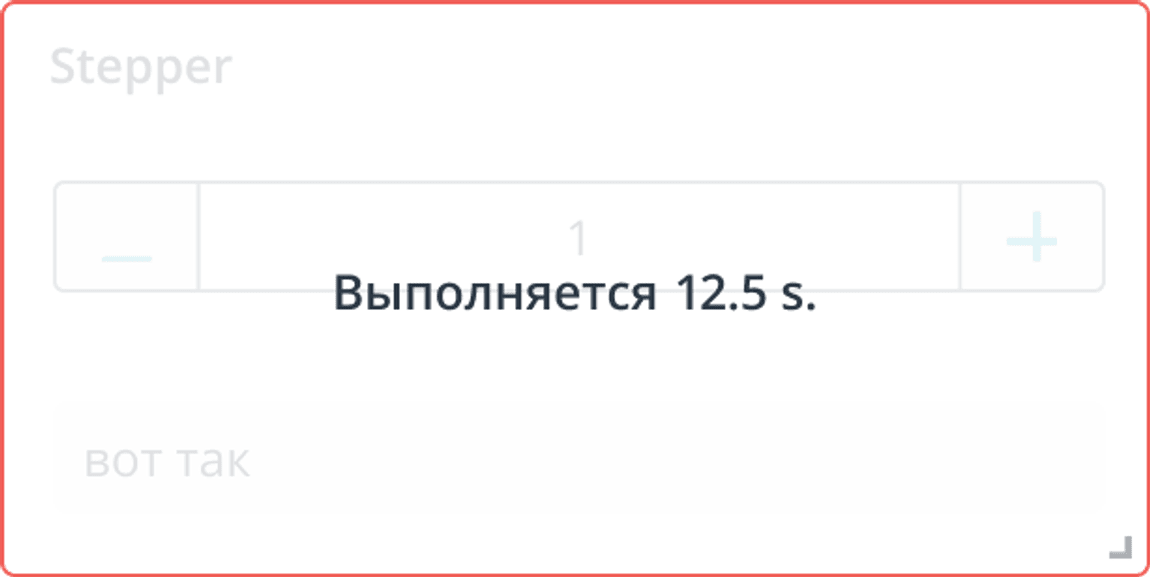
Added the result of command execution in dashboards. A timer is activated while waiting for the command to be executed. A notification appears when a command is successfully or unsuccessfully executed.
More improvements
-
Added auto-update of command and event history to “Object”.
-
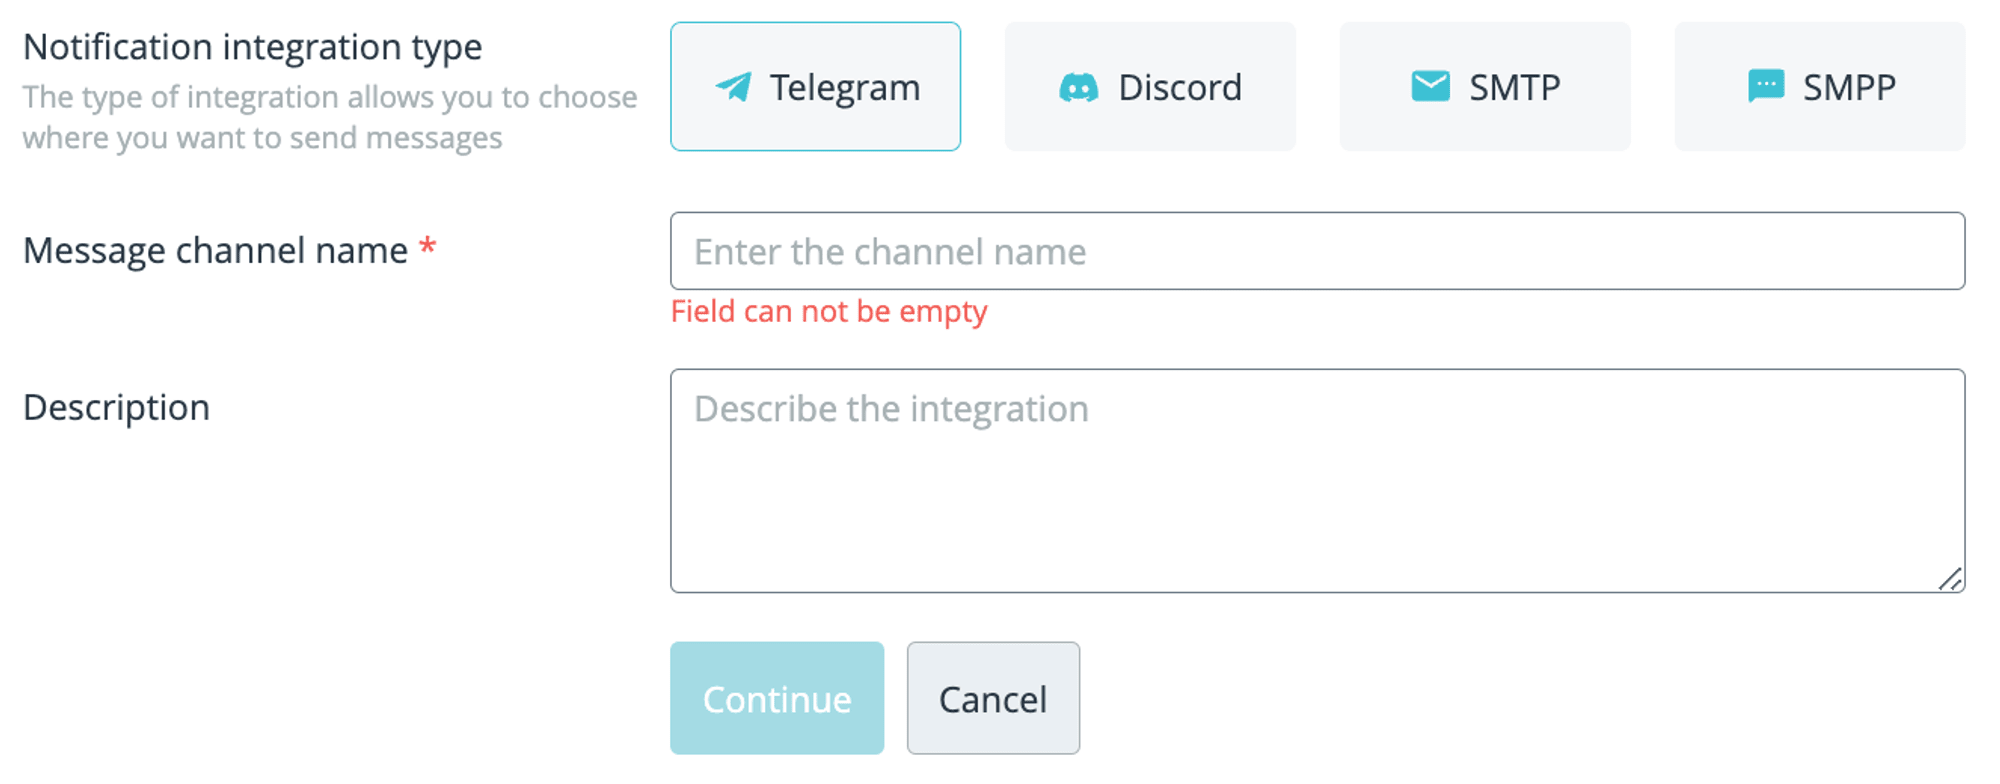
SMTP and SMPP have been moved to “Project Settings” in the ‘Integrations’ section.
-
Logo upload and project limit management has been added to “Project Settings” under “Roles”.
-
Updated icons in the Models.
-
Bug fixed and updates applied.