Journal
Status
After successful authorization, the object will immediately change its status to Online and will show the
time of receiving the packet. When the data is received, it will be displayed in the interface according to the model.
according to the model. Parameters that are sent by the device, but not created in the model with the correct source, will not be displayed.
in the model with the required source will not be displayed.
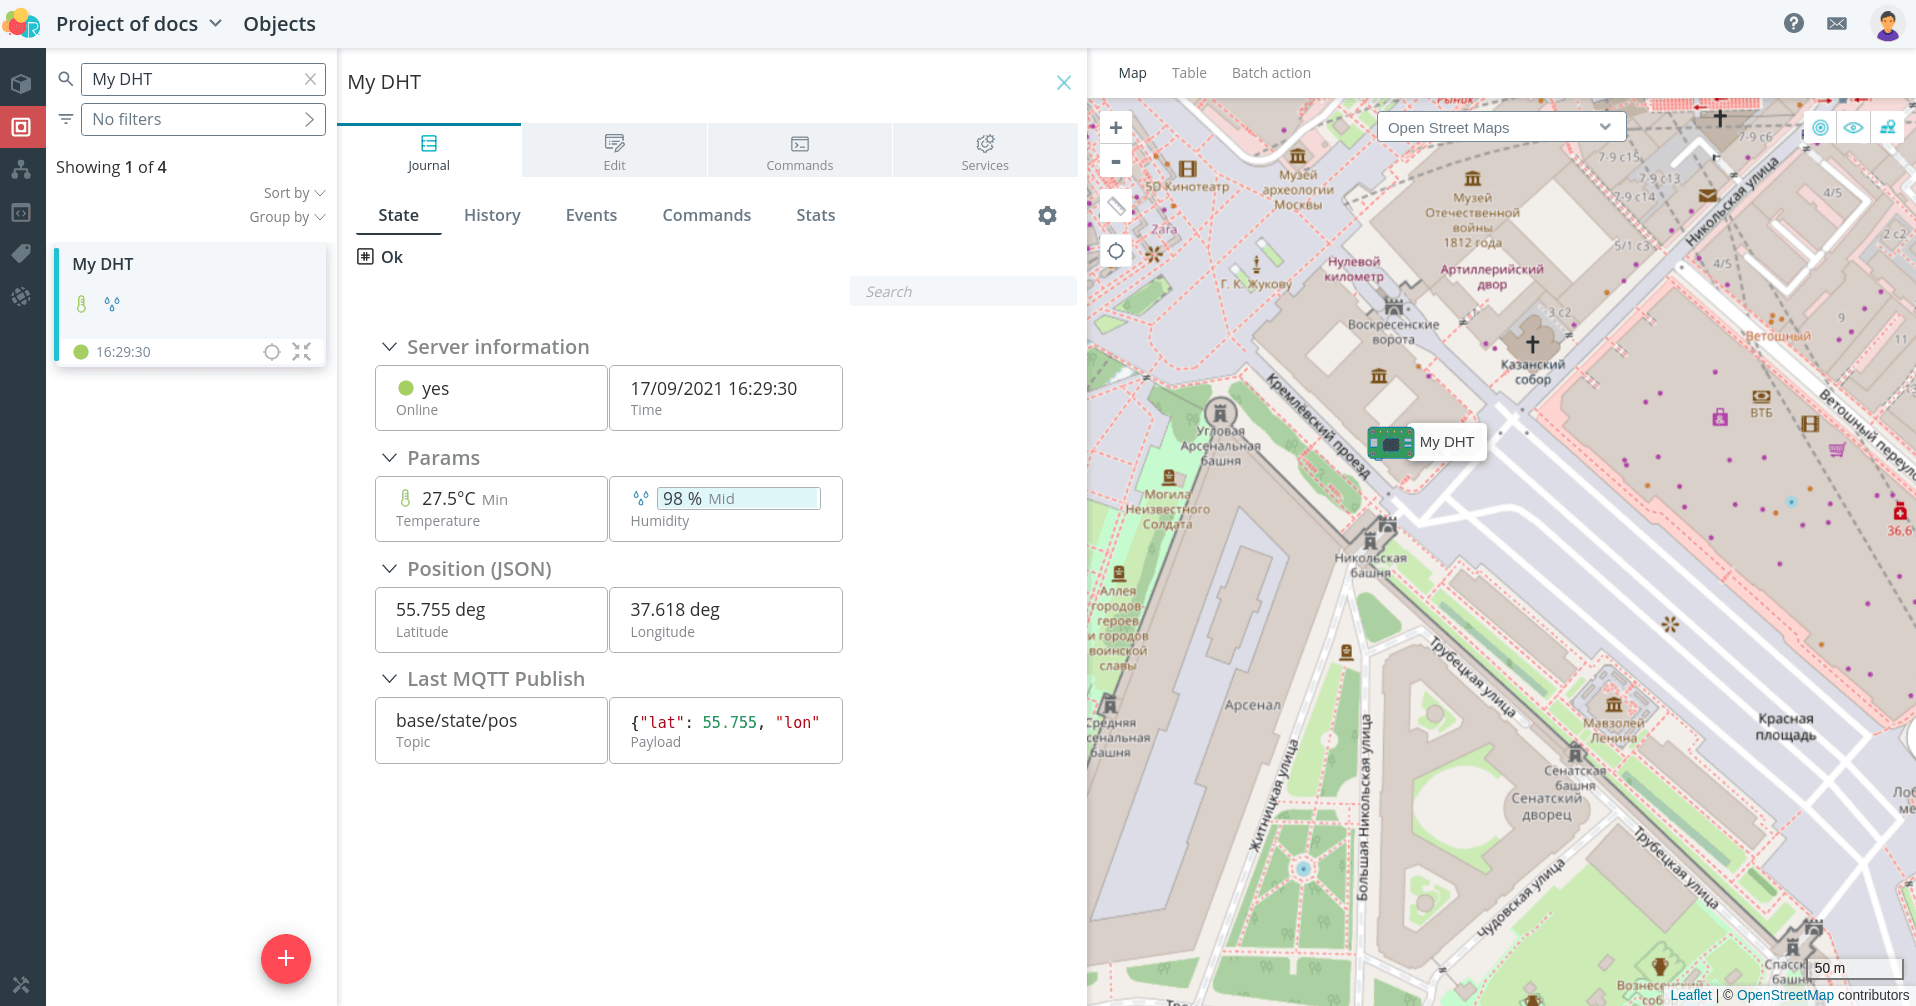
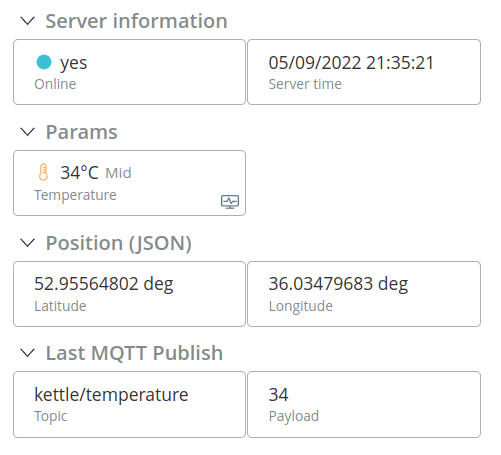
The argument card interface is built according to how it is described in the
model.
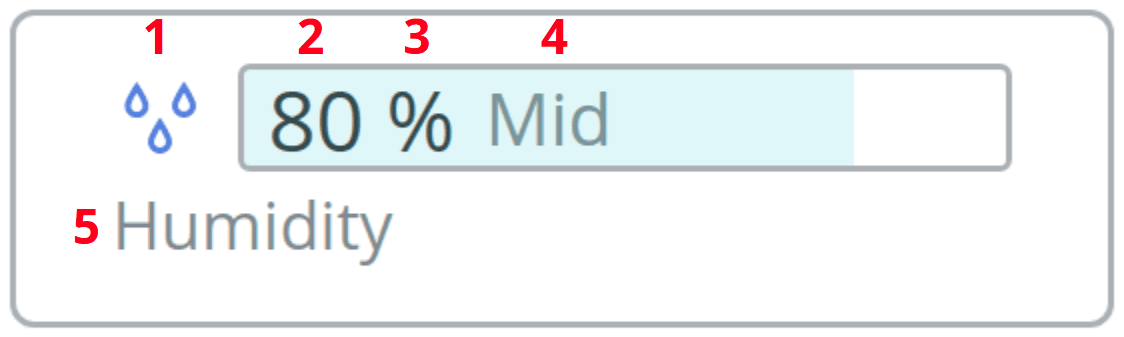
- The svg image selected in the model
- The value with the data type specified in the model
- The unit of measurement specified in the model
- text of the level corresponding to the obtained value
- Name specified in the model. When you hover over it, the description of the argument, if it is specified. Also when you click on the name, you can quickly jump to this parameter in the model.
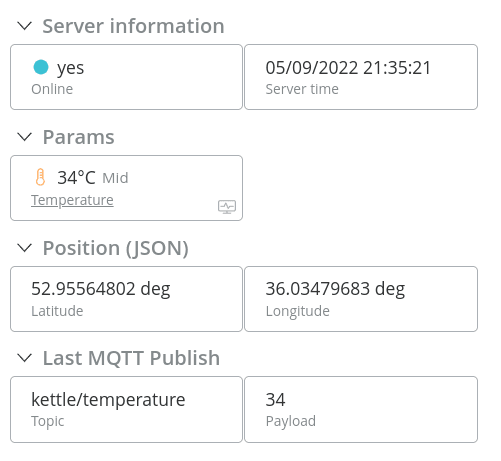
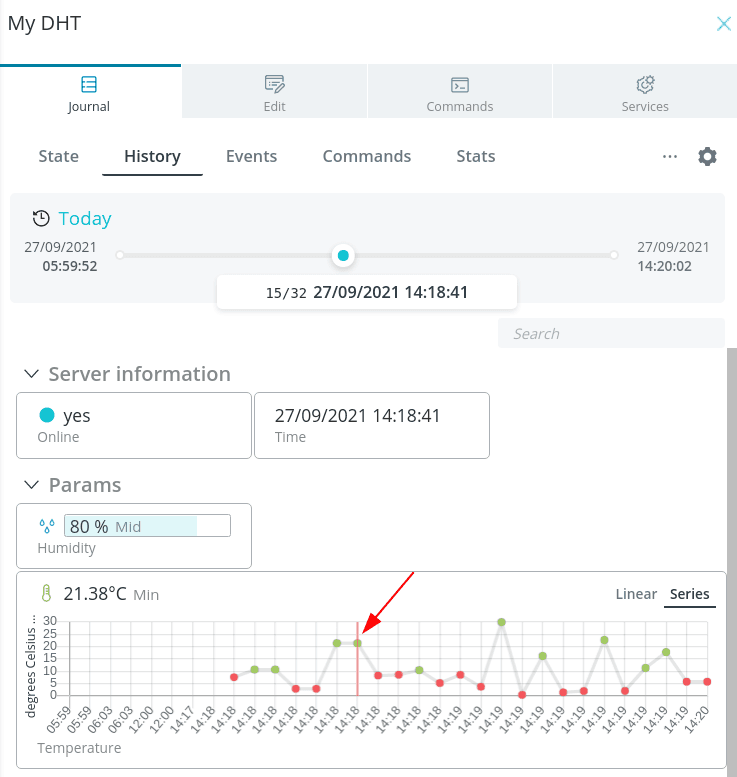
To view a graph for a parameter, click on the icon in the lower right corner of its
card. It appears when you hover over a parameter and is available only for
numeric and logical data types. The graph is formed for the current day. To
to view the chart for a certain period, go to the tab
History tab.
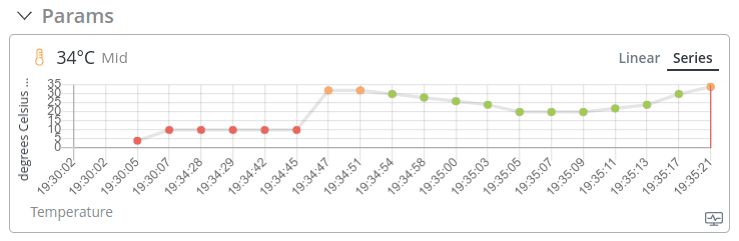
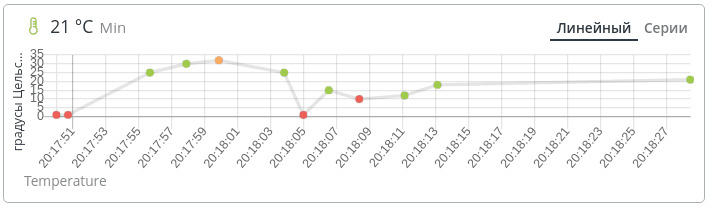
| In Linear mode, the time grid is displayed at regular intervals. This mode is useful when you want to evaluate the change in readings based on the time they were taken. | In Series mode, the time grid is scaled so that the readings are displayed evenly regardless of the time delay between them. This mode is useful when the device has not sent data for a long time, or when it sends data very often. |
|---|---|

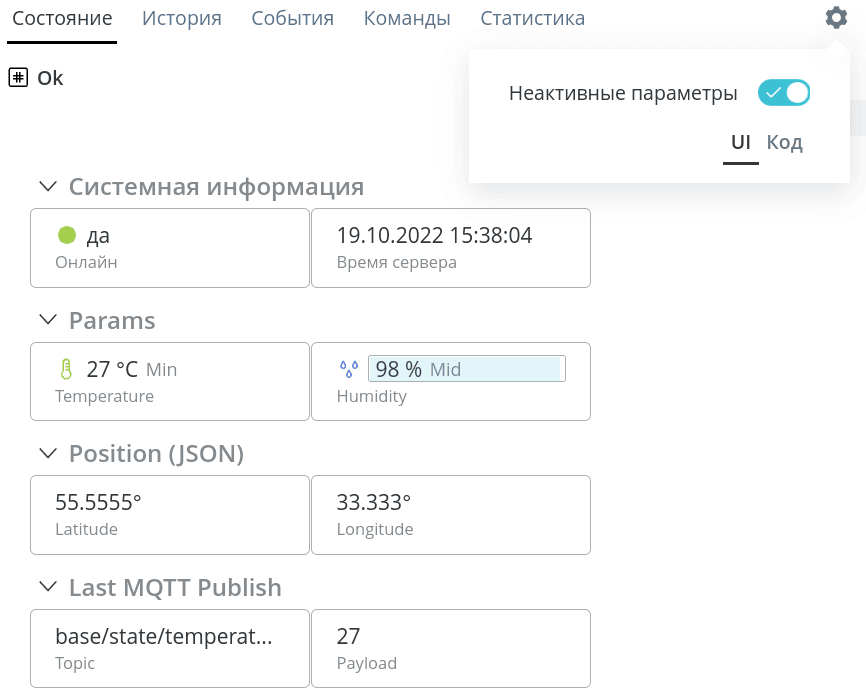
To hide inactive settings, click the gear in the upper right corner and
turn off Inactive Parameters.
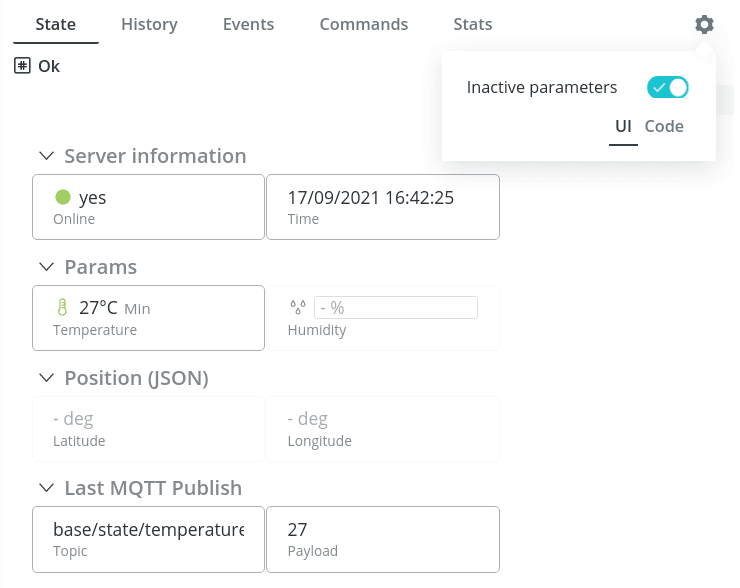
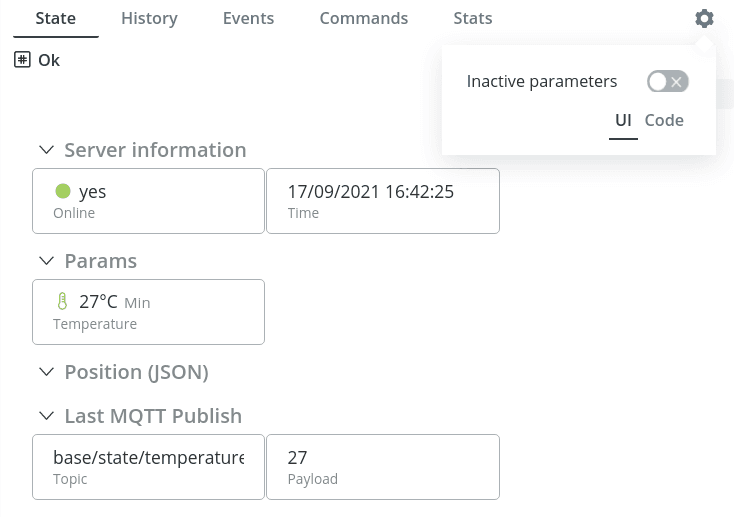
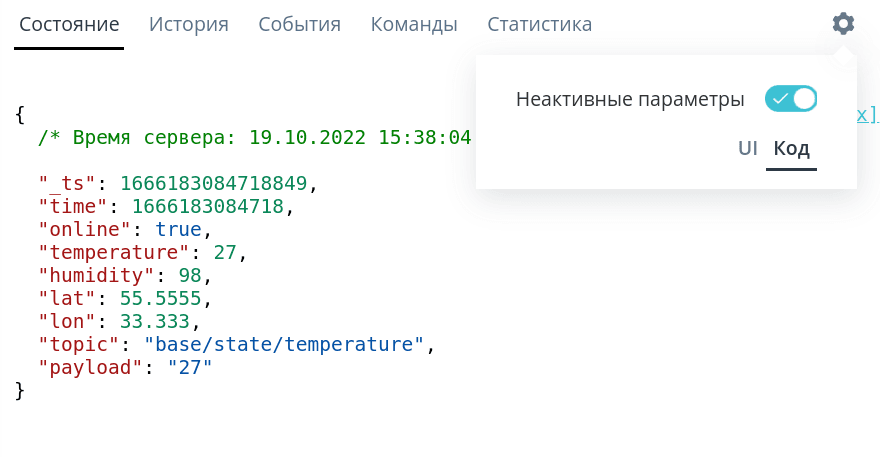
There you can also choose the format for displaying the object data: UI (User interface)
or Code.
History
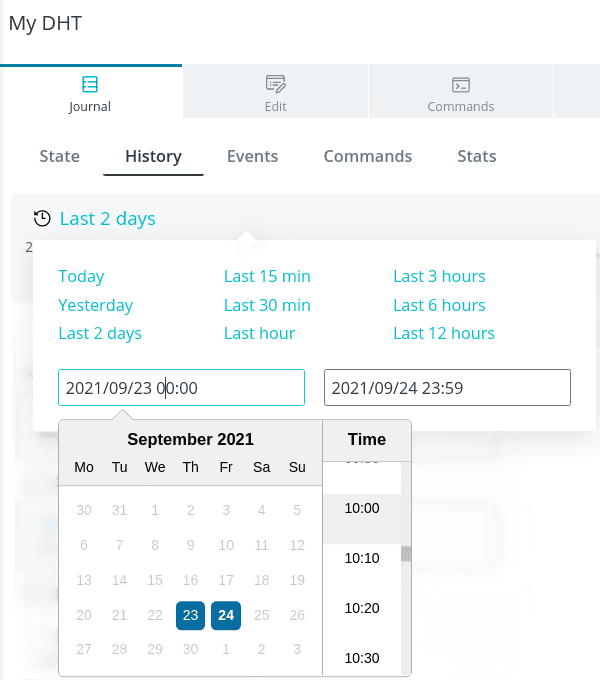
Under History you can get the history of data packets from the device for the selected period.
for a selected period of time. There are a number of presets that can be used at once
(Today, Last 2 days, Last hour, etc.) or
or use the calendar to select a specific date and time. Please note
Note that only the dates on which the device sent the data are available for selection.
data.
When viewing the history, open the graph by parameter and then clicking on the
the value of interest, you will immediately see the packet received at this time from the
device.
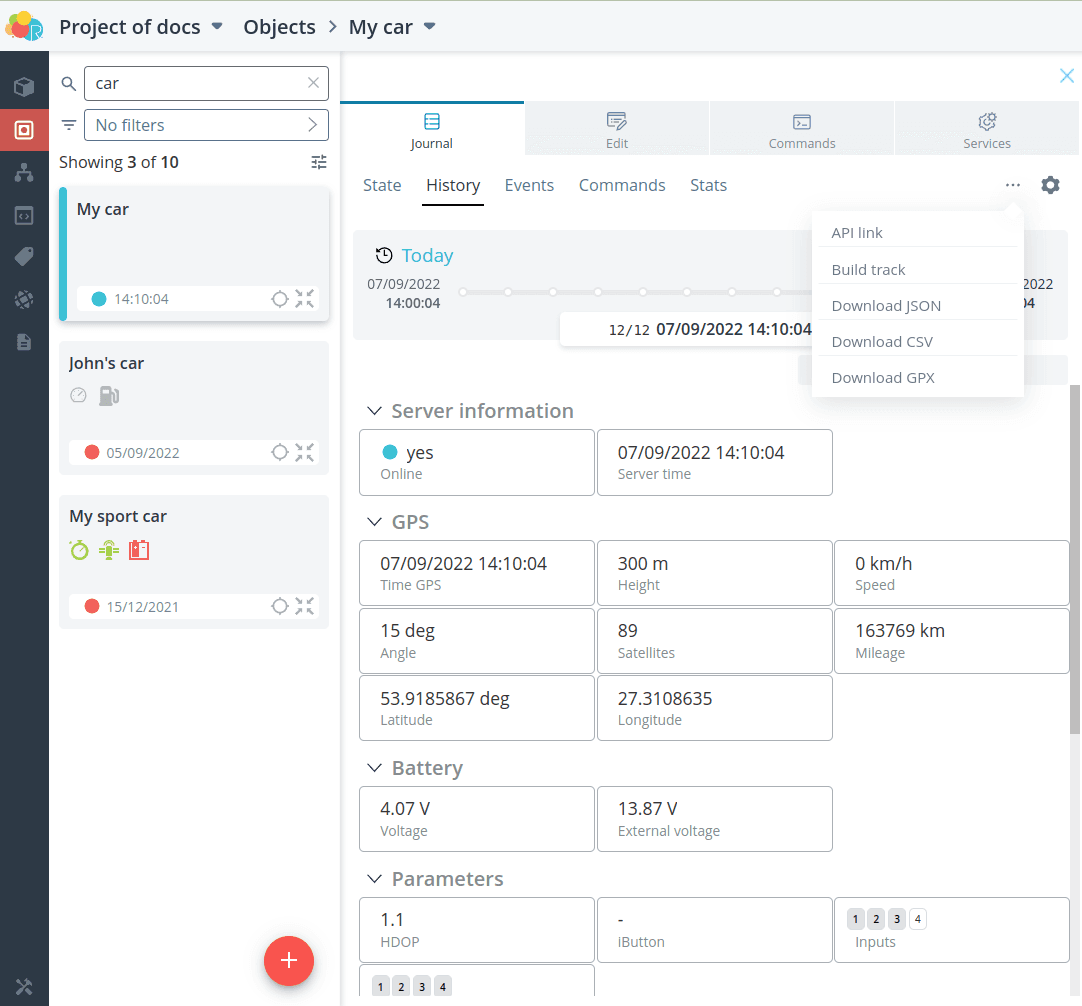
Click on the three dots in the upper right corner of the screen to open additional
actions:
- API link - display package history in a new tab in the format of JSON (opens in a new tab), similar to an API request;
- Build track - build track for the selected period;
- Download JSON - download packet history as a JSON file;
- Download CSV - download packet history as a CSV file;
- Download GPX - download packet history as a file in GPX format.
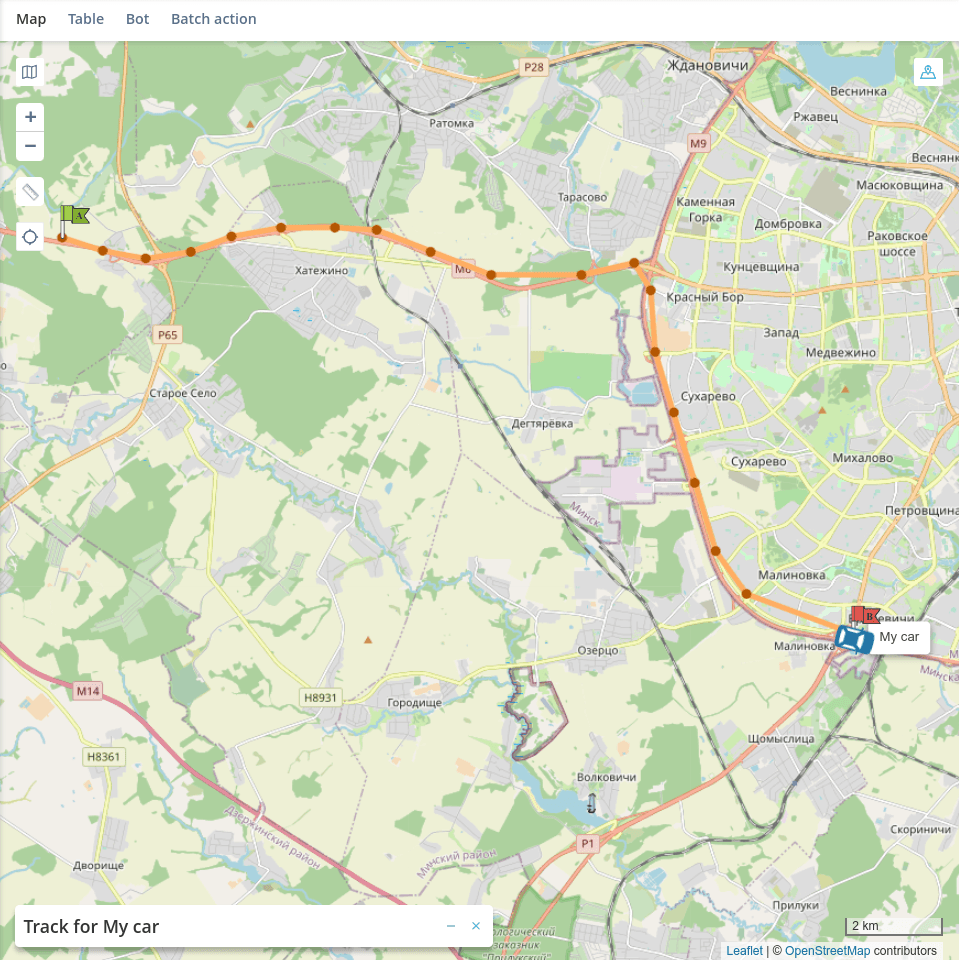
Tracks
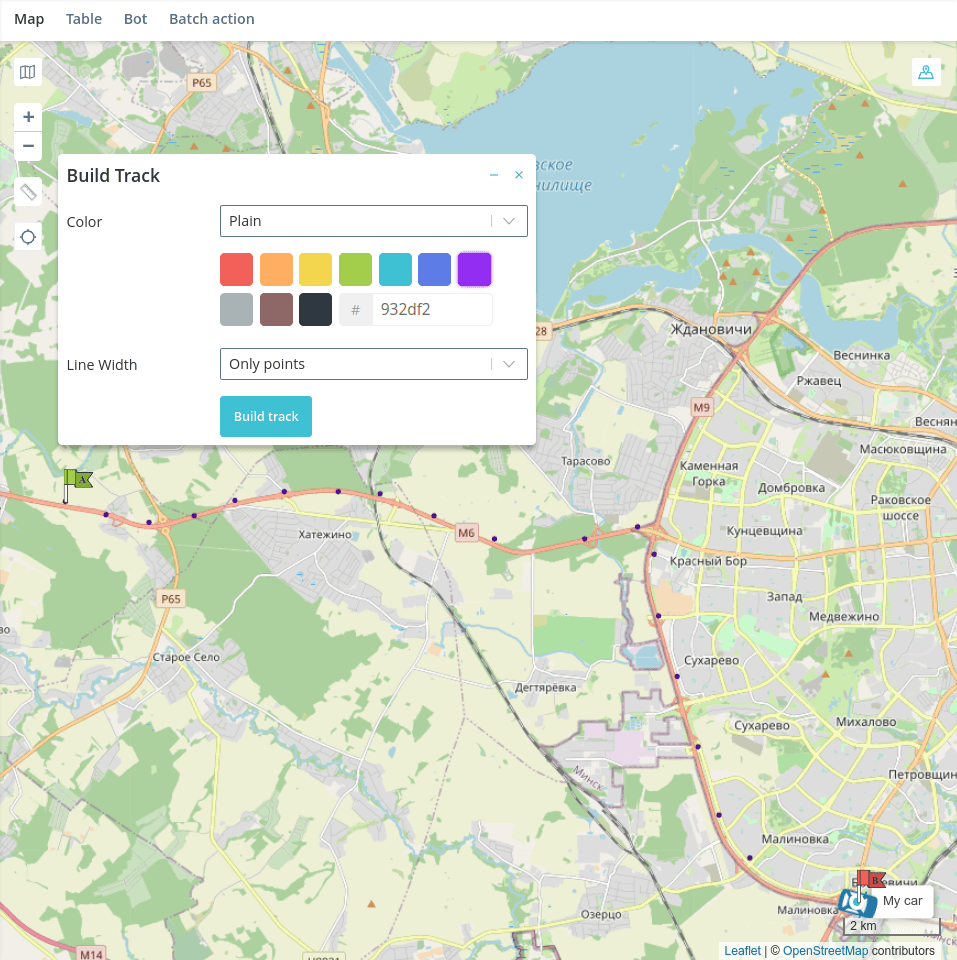
To build a track of the device movement for the selected period, press the button
Build Track.
The track settings window will open on the right side of the map:
-
Color:
- Single color - the track line will correspond to the selected color;
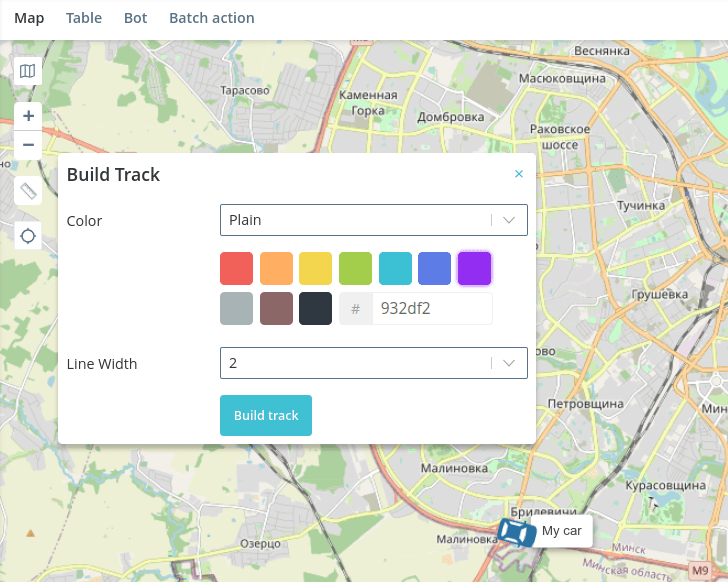
- Speed - the color of the track line segments will correspond to the received speed value (at that moment of time).
speed value at this moment of time (parameter with
speedidentifier);
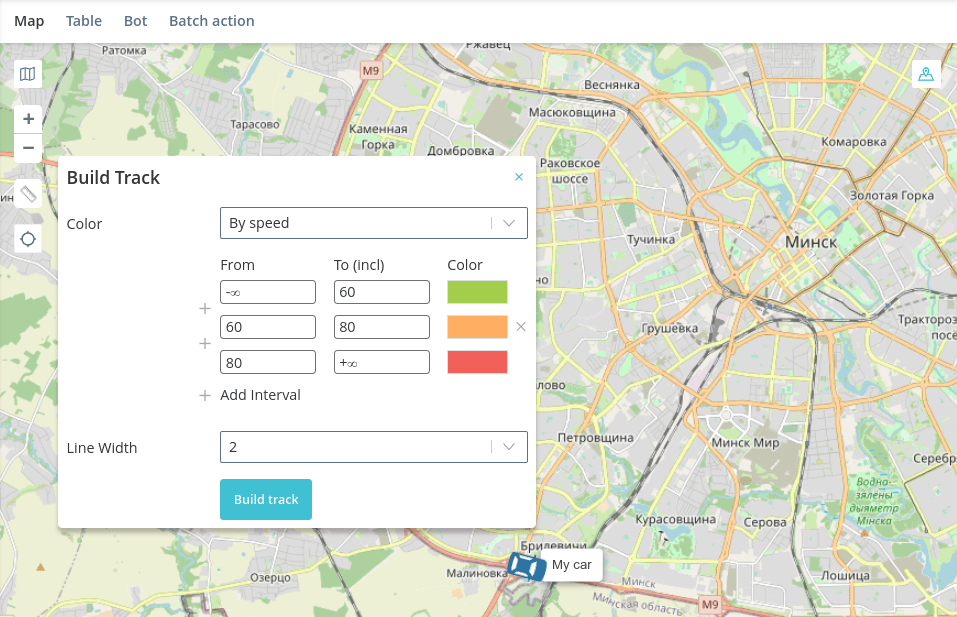
- By parameter - the color of the track line segments will correspond to the received value of the selected parameter at this moment of time.
💡
If levels are set for the selected parameter in the model, they will be
automatically will be automatically loaded into the track building interface.
They can be left as they are or or you can adjust them at your discretion.
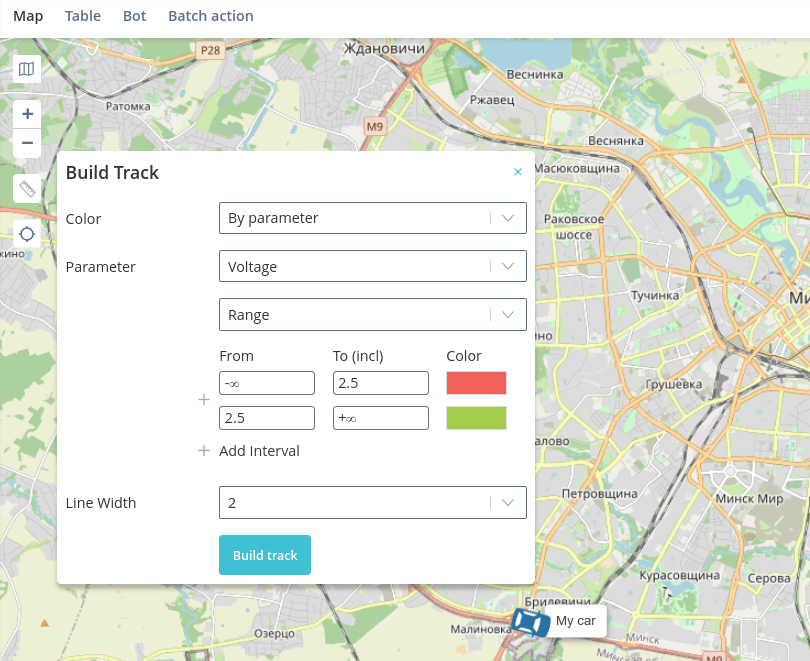
-
Line Thickness:
- Points only - the track will consist only of points corresponding to the the moment of receiving a data packet from the device;
- 1, 2, ..., 10 - the track will consist of points and a line of specified thickness.
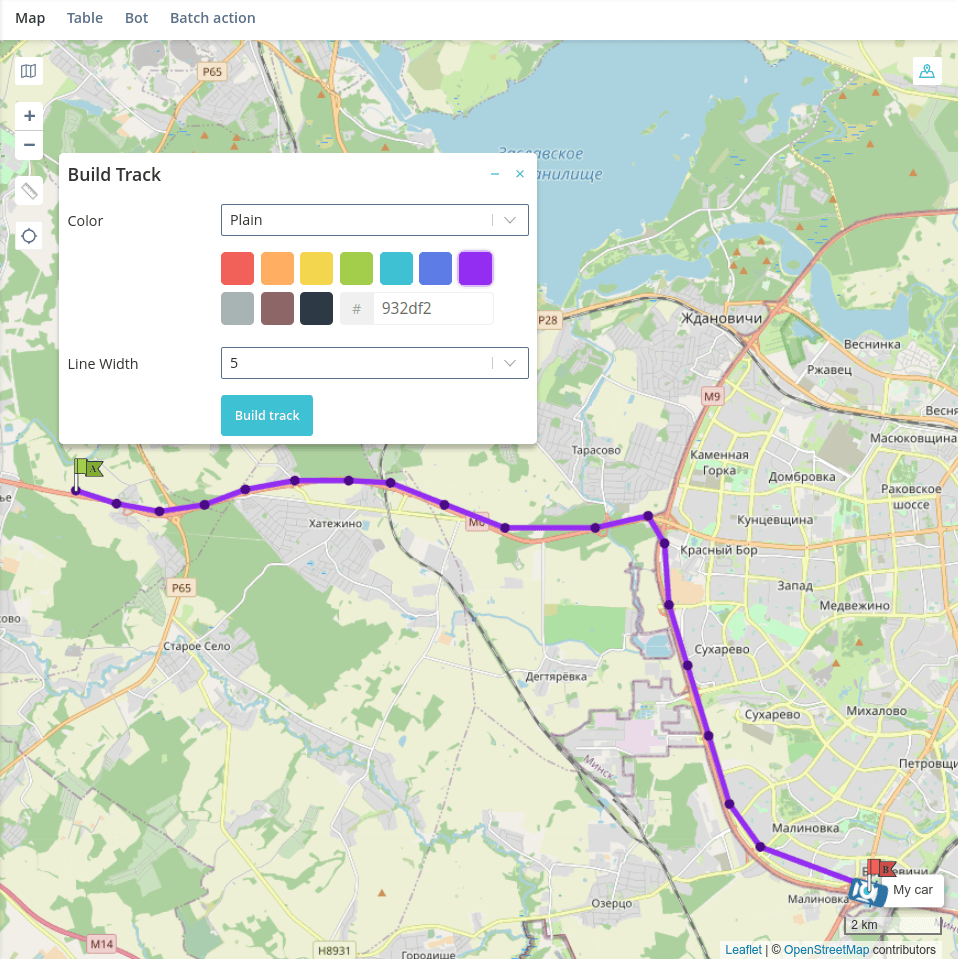
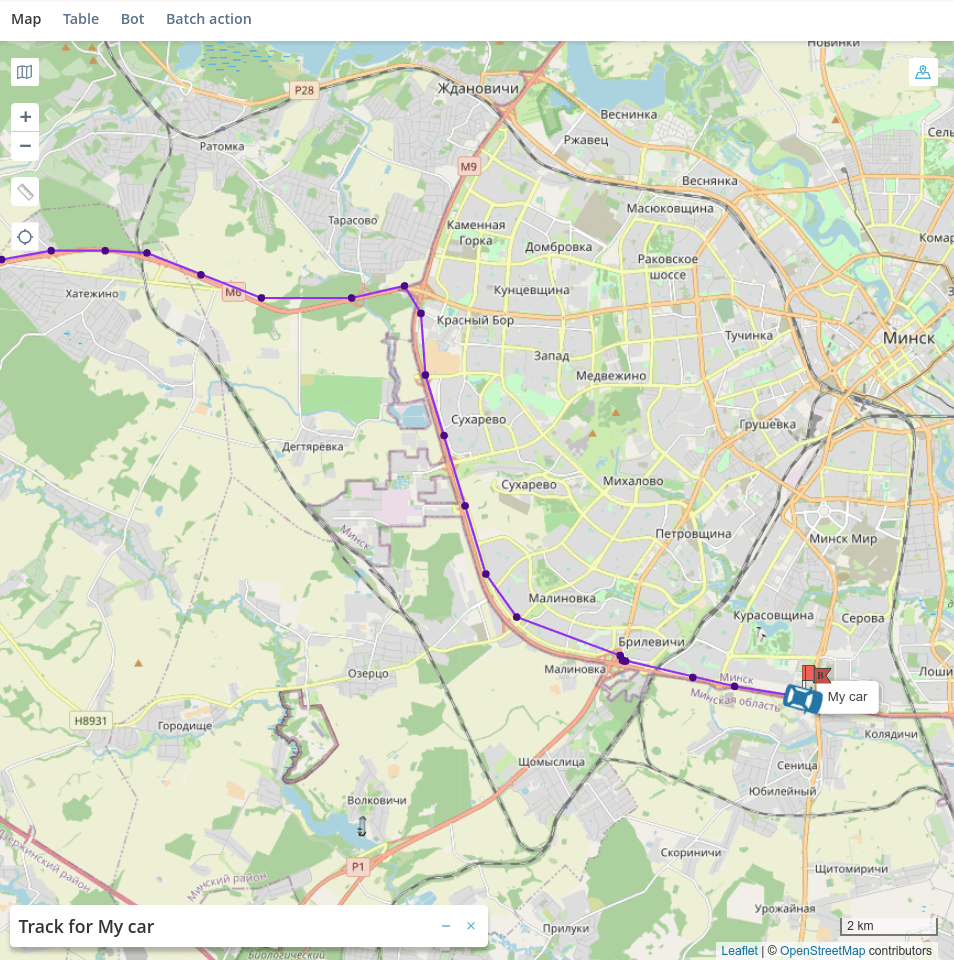
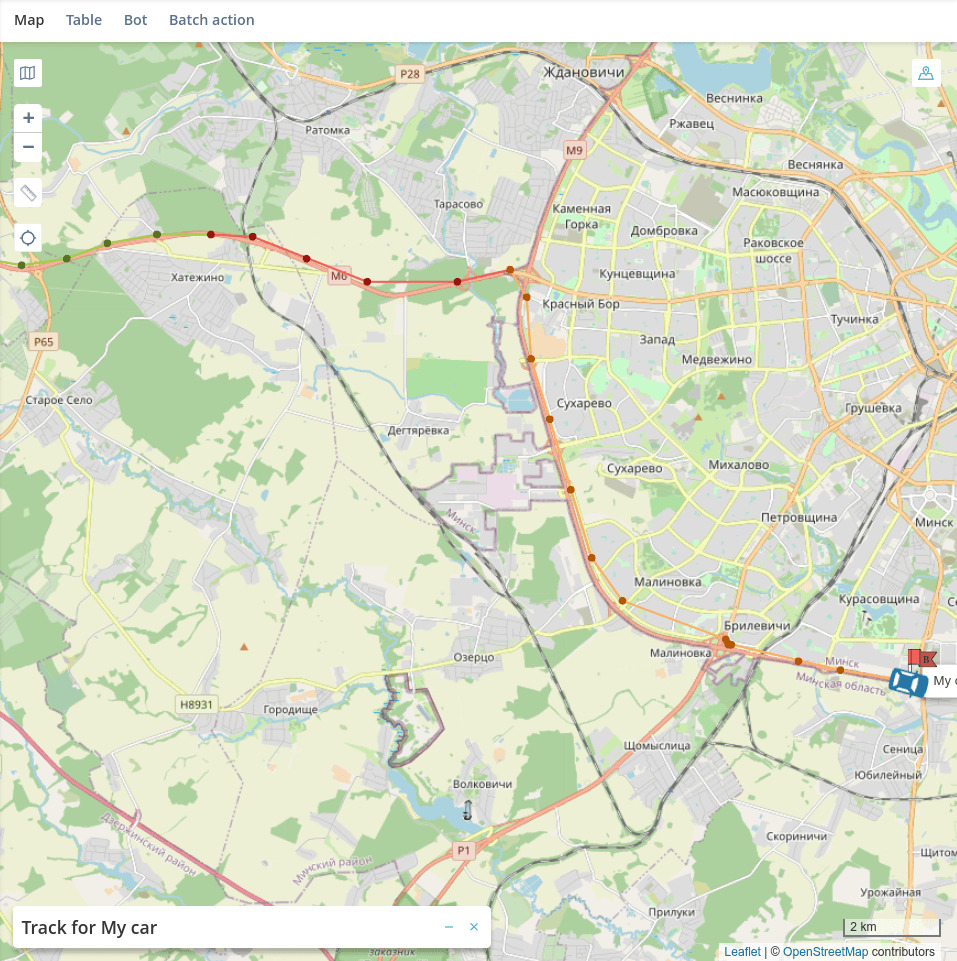
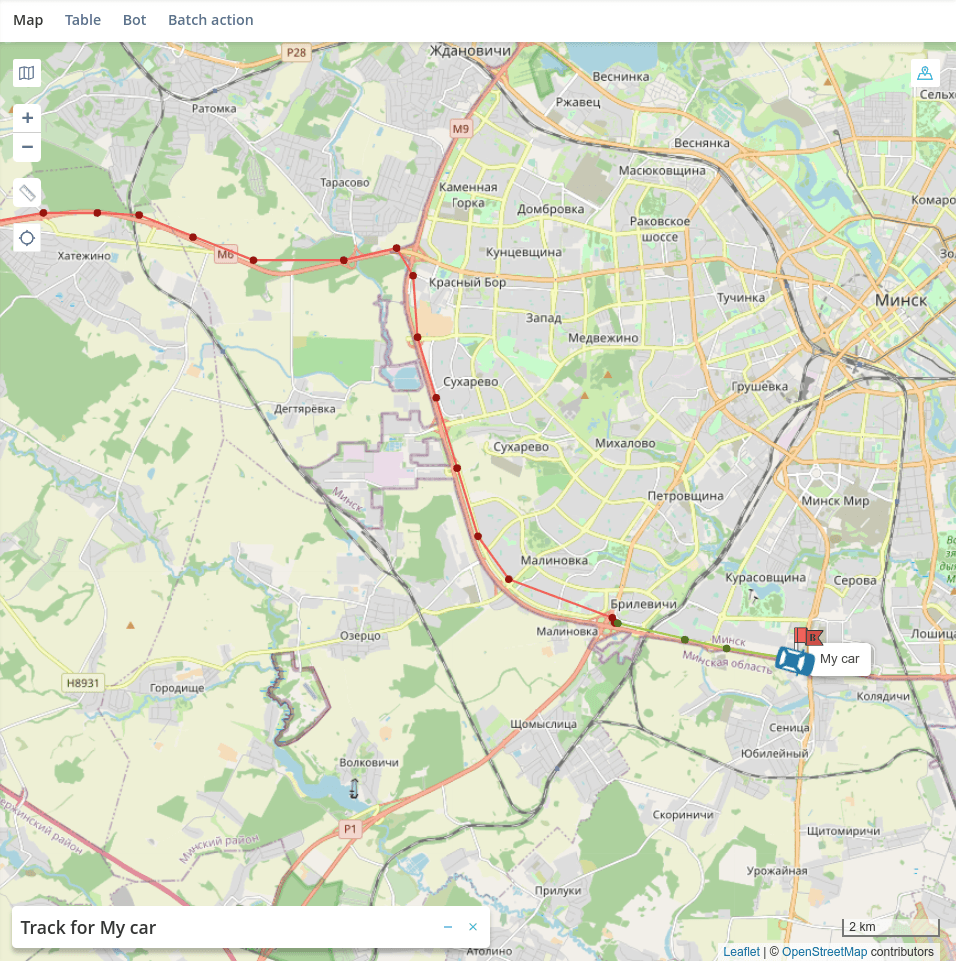
Click the Build track button. You will see the constructed track. Its parameters
can be changed by clicking the hide/unhide button on the track bar at the bottom of the map.
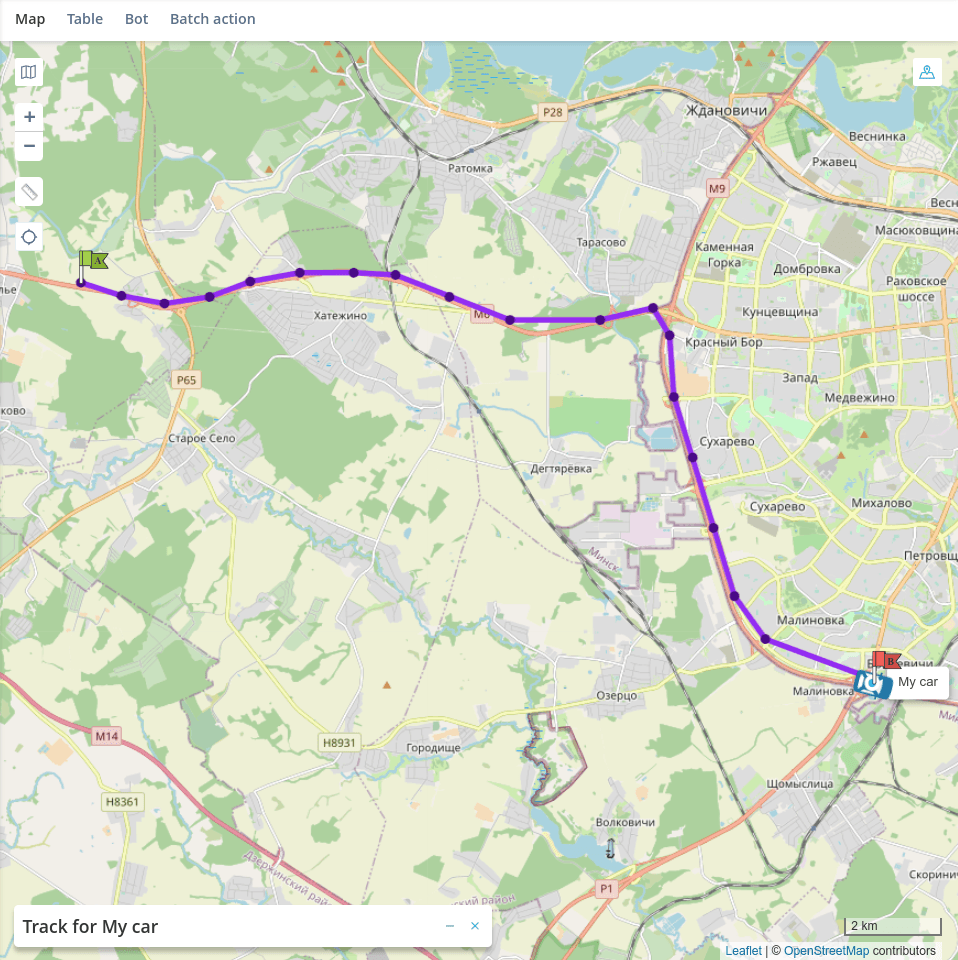
Hover over a track point to view information about a data packet,
received at that point in time.
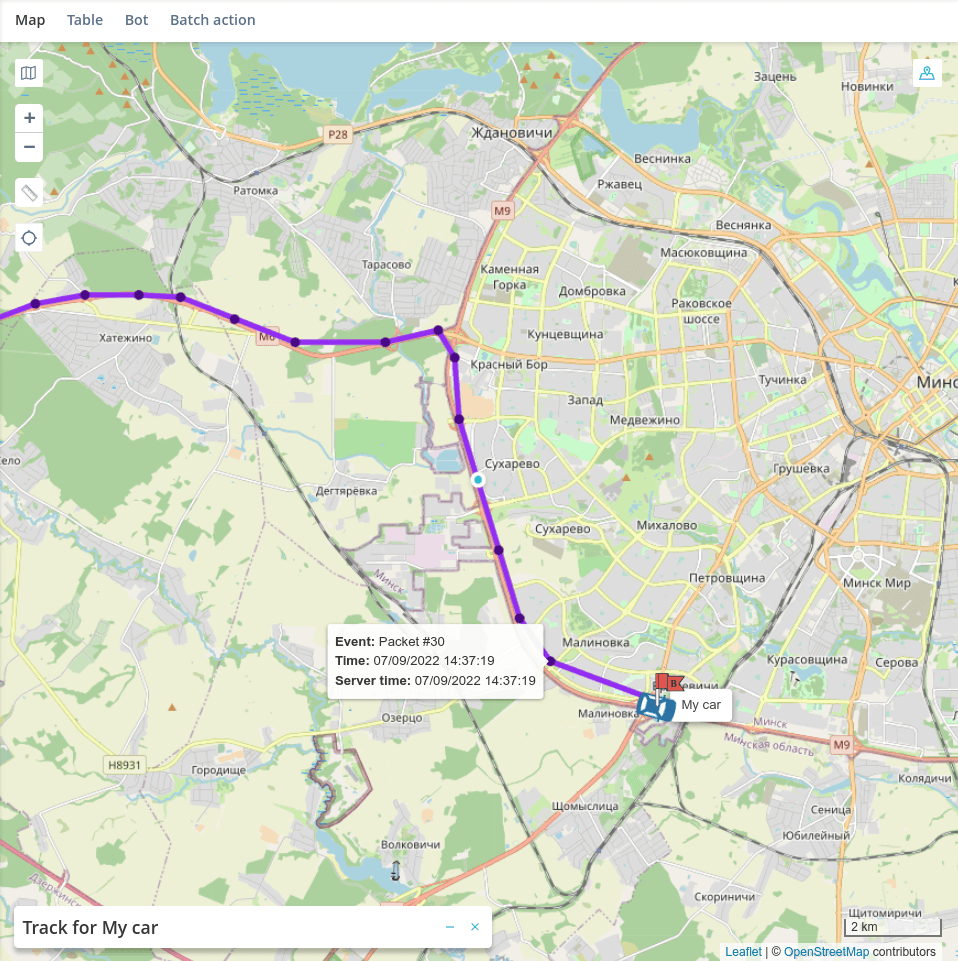
Click on a trackpoint to jump to that data packet in the history.

💡
When you move the slider across history, the slider point on the track is also
moves as well.
When you have finished working with a track, click the cross on the track construction bar to
delete the track from the map.
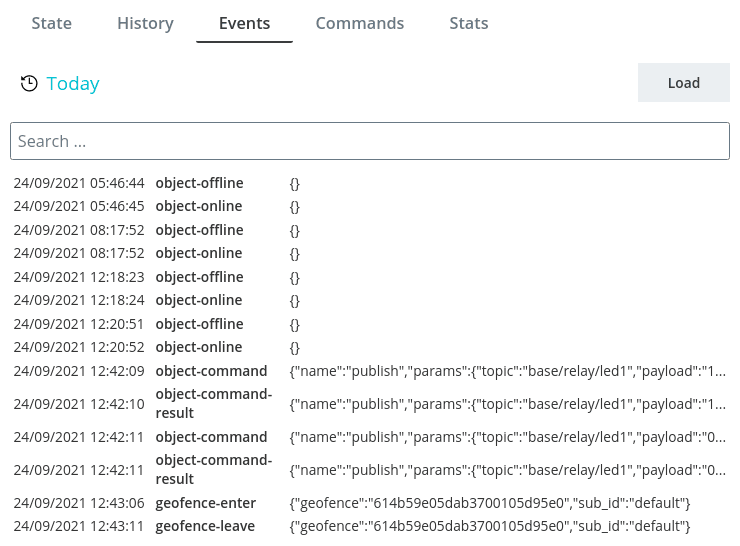
Events
In the Events section you can view the history of all recorded
events** you can see the history of all recorded actions that happened to the device during the selected period. There can be
both the events built into the system and additional events created in the
object model.
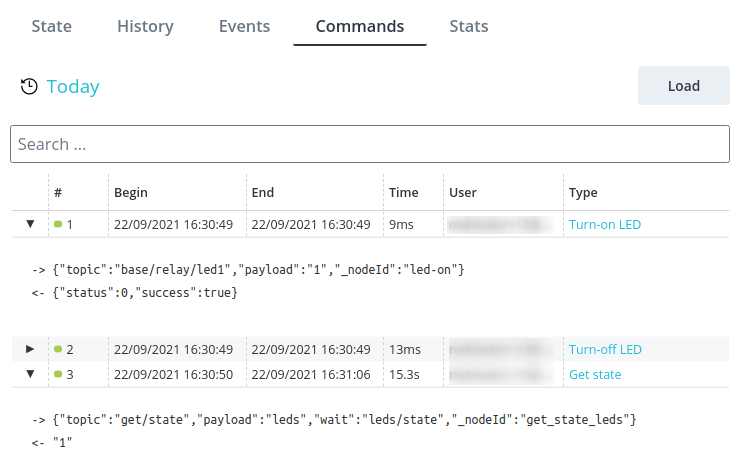
Commands
Command history allows you to view all commands sent to the device during the selected period along with the result of their execution.
selected period along with the result of their execution. Expand a specific
command to see the response from the device.
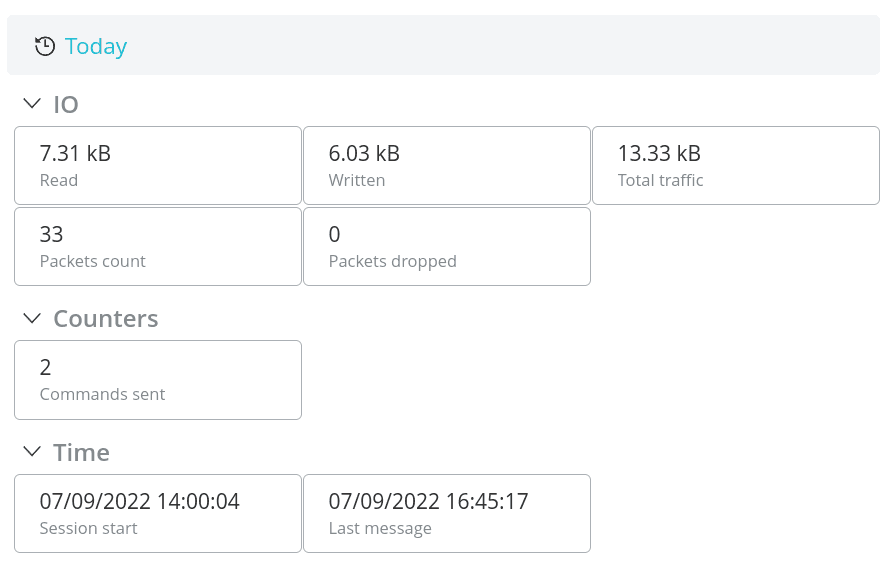
Statistics
Statistics allows you to examine the activity of the object, evaluate the needs of the project at the
prototyping stage and, if necessary, adjust device operation or
license parameters.
The upper part of the section indicates:
- the number of automata added to the object;
- number of handlers added to the object;
- number of packets received on the object;
- storage capacity.
In the numerator is the current number, in the denominator is the maximum allowable number for a given project.
for this project.
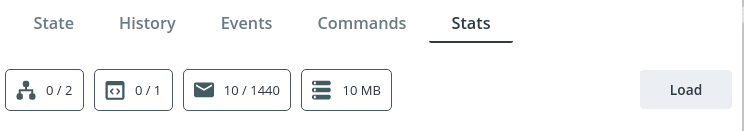
At the bottom - history by traffic and number of commands sent to the device.