Generating a report
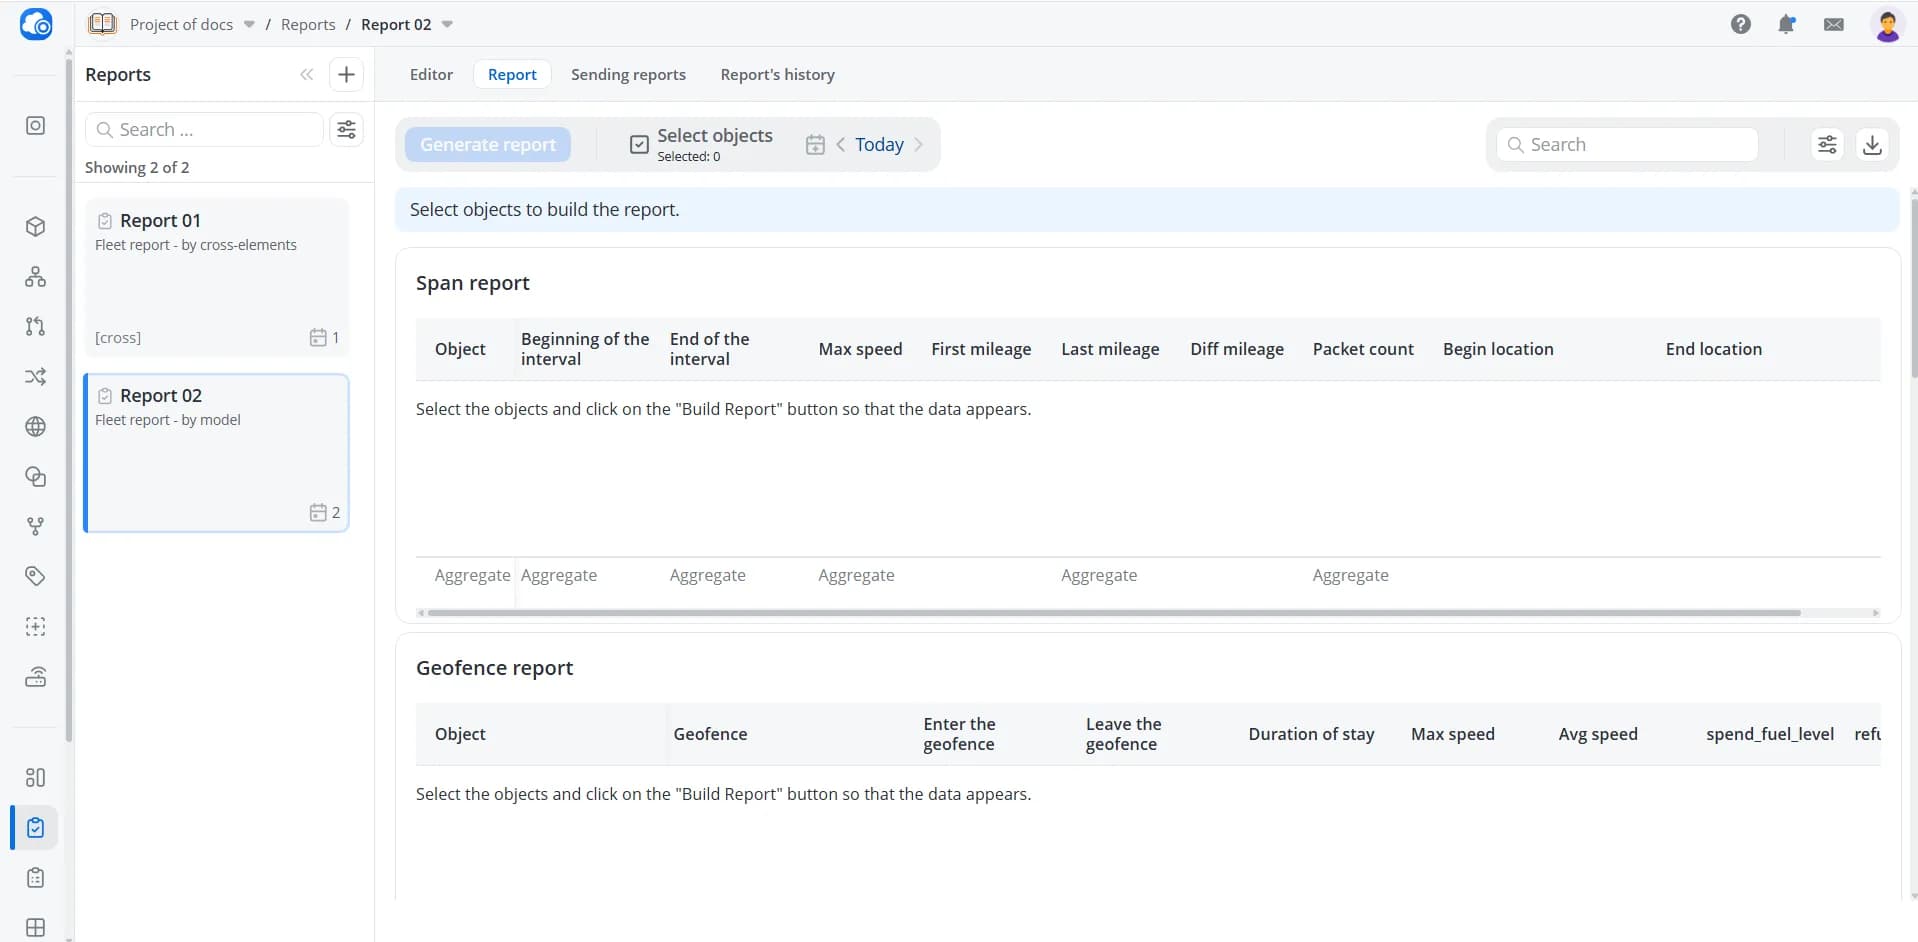
After adding all the required tables to the report, open the Report tab.
Selecting objects
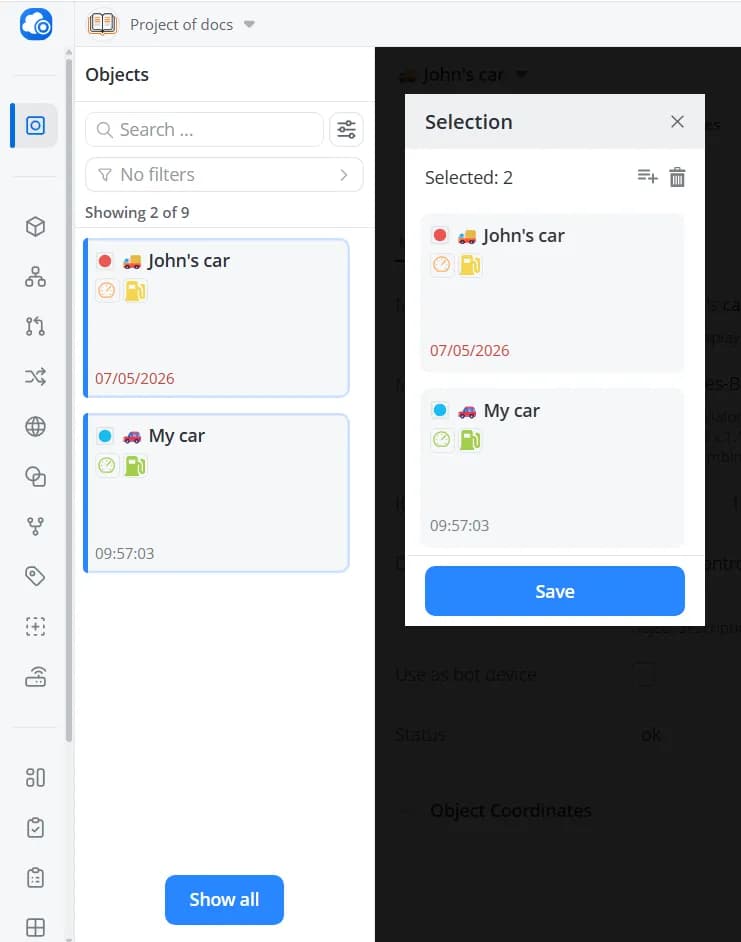
Click Select objects and choose the objects for which this report will be generated.
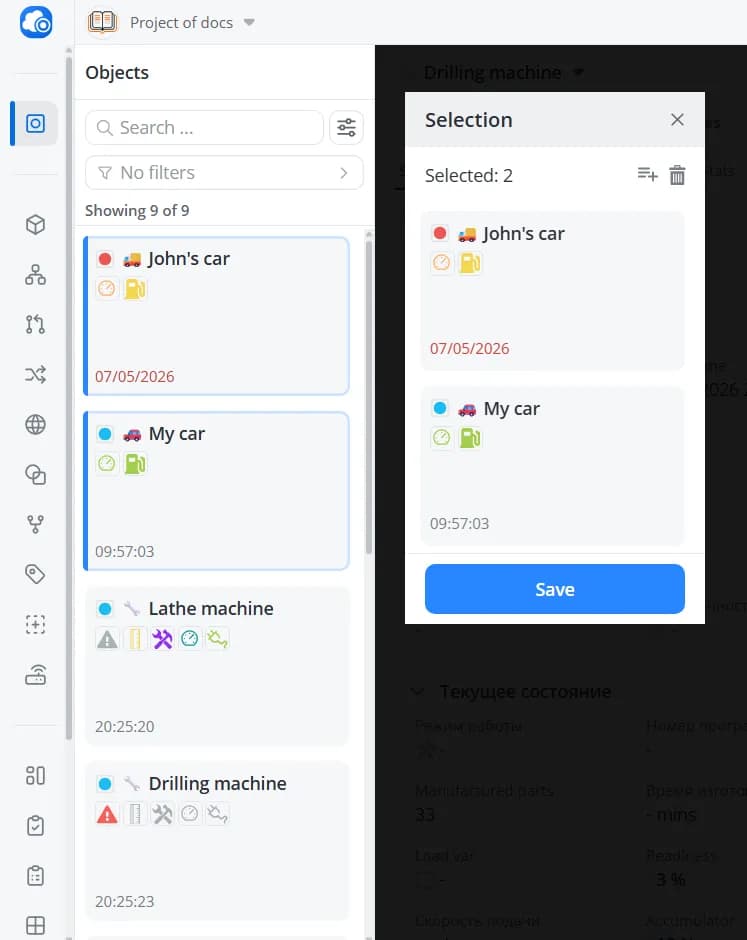
For By cross-elements reports, the list displays only objects whose models have parameter-to-cross-element mappings
configured. If you want to generate a report for an object with a different model, click Show all to display the
complete list of objects in the current project.
For By parameters from model reports, all objects are displayed.
Click Save.
Selecting a time period
This setting allows you to choose the time period for which data should be displayed in the report tables. You can use
one of the available presets (Last 15 min, Last hour, Today, etc.) or select a specific date and time
from the calendar. The selected period is preserved when switching between reports. If you refresh the page,
preset-based intervals are also preserved, while a custom range selected through the calendar will reset to the default
Today preset.
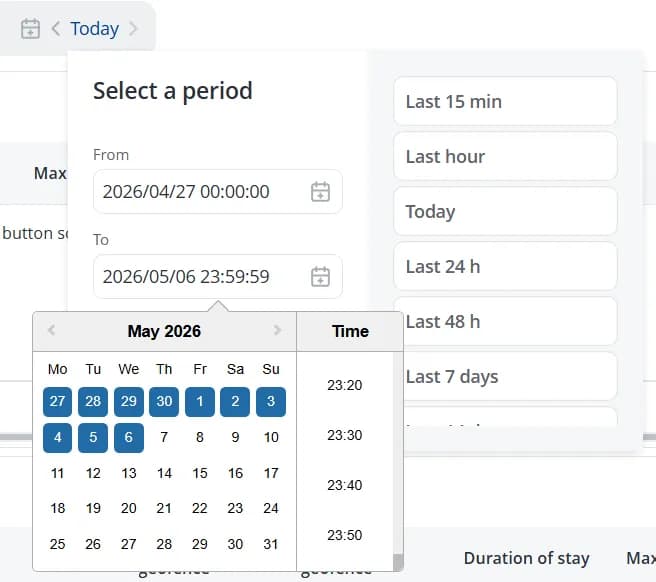
After selecting the time range, click Generate report.
💡
If a large amount of data has accumulated for the selected time period, you can either wait for the report to finish
generating or click Stop.
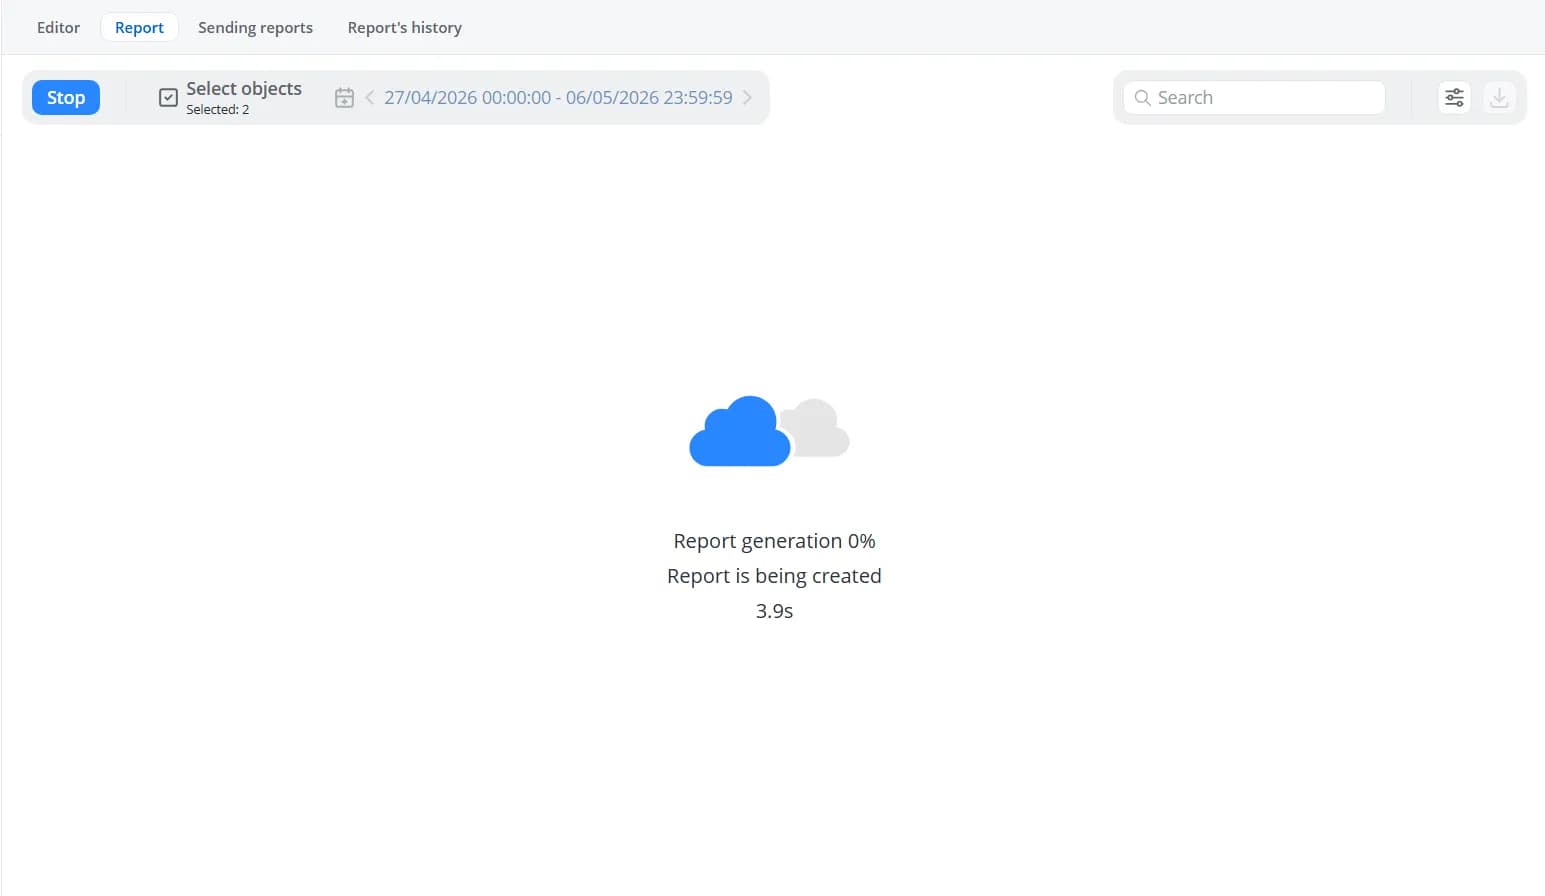
Reports are generated in the background, so you can continue working in other sections of the platform while the report
is being processed. You can later check its status in the Report's history tab.
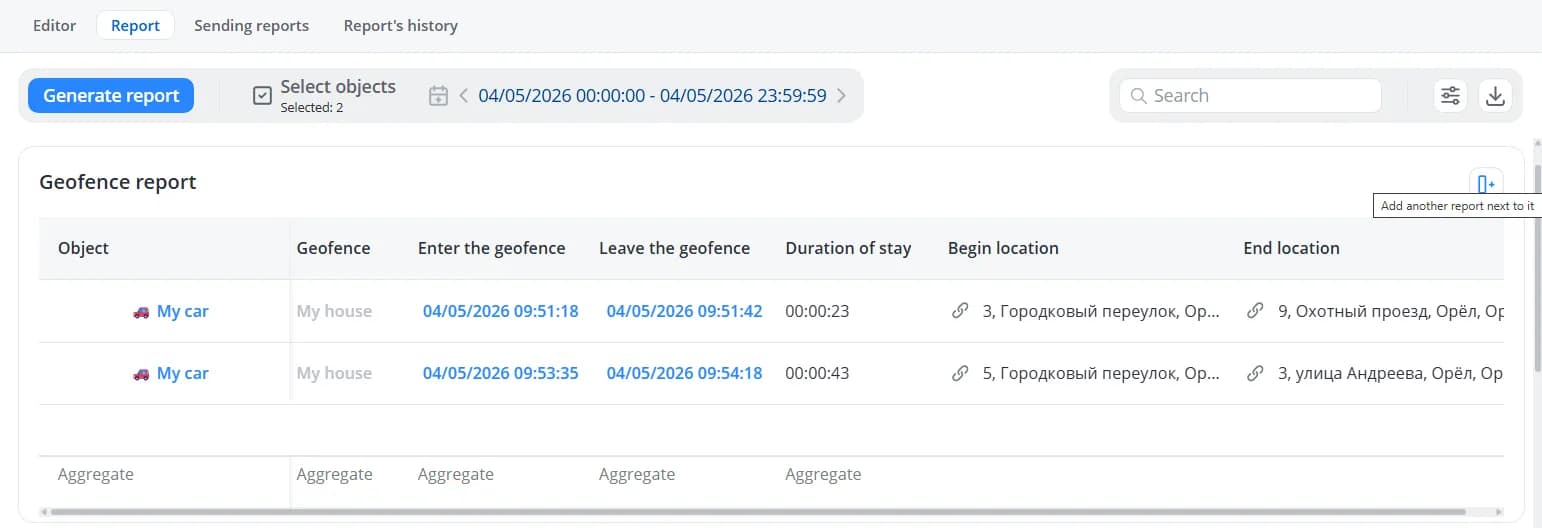
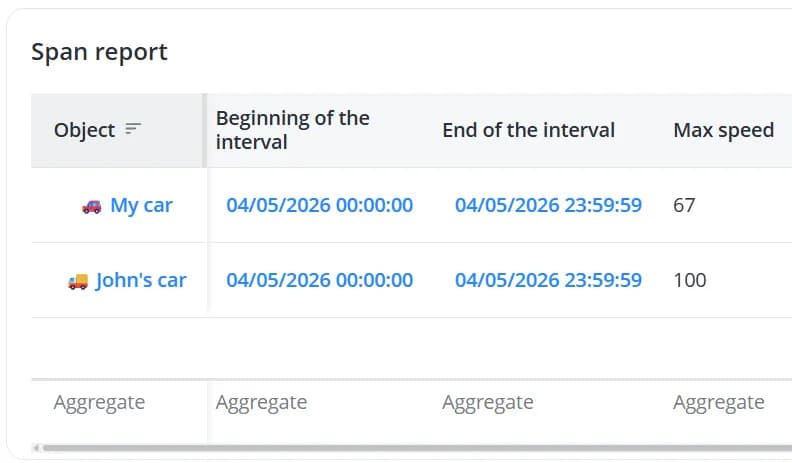
The report tables will display data for the selected objects within the specified time range.
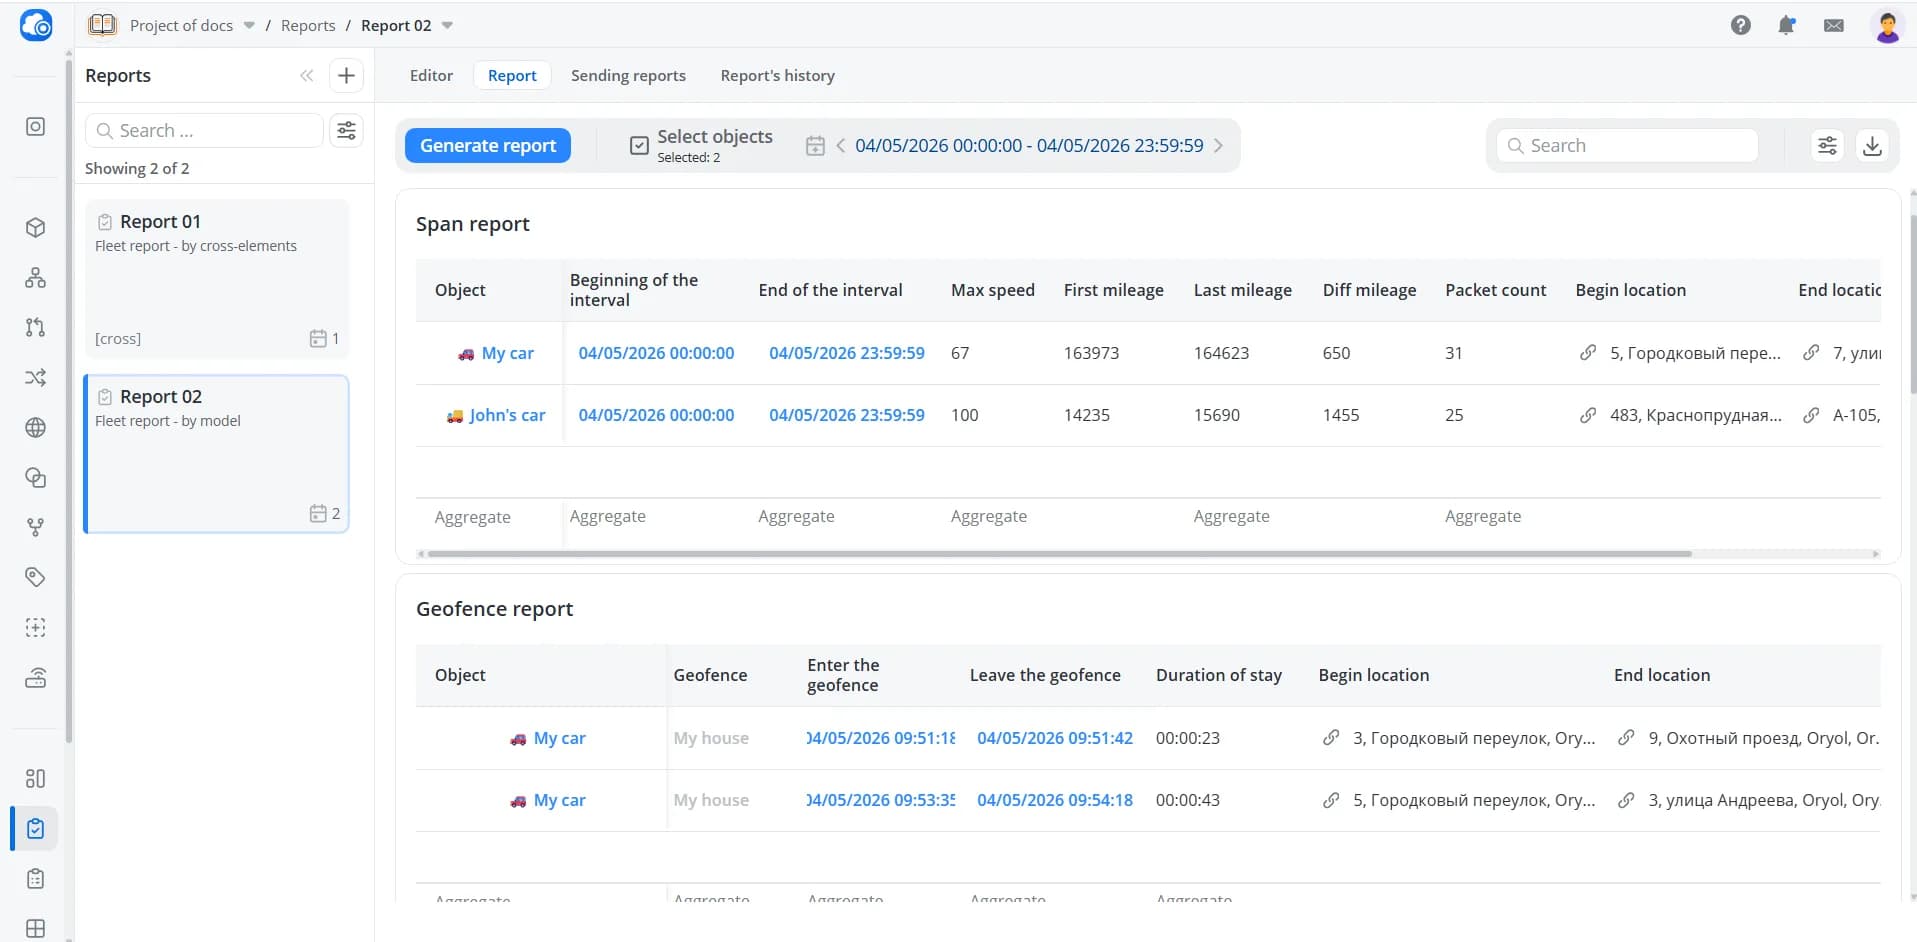
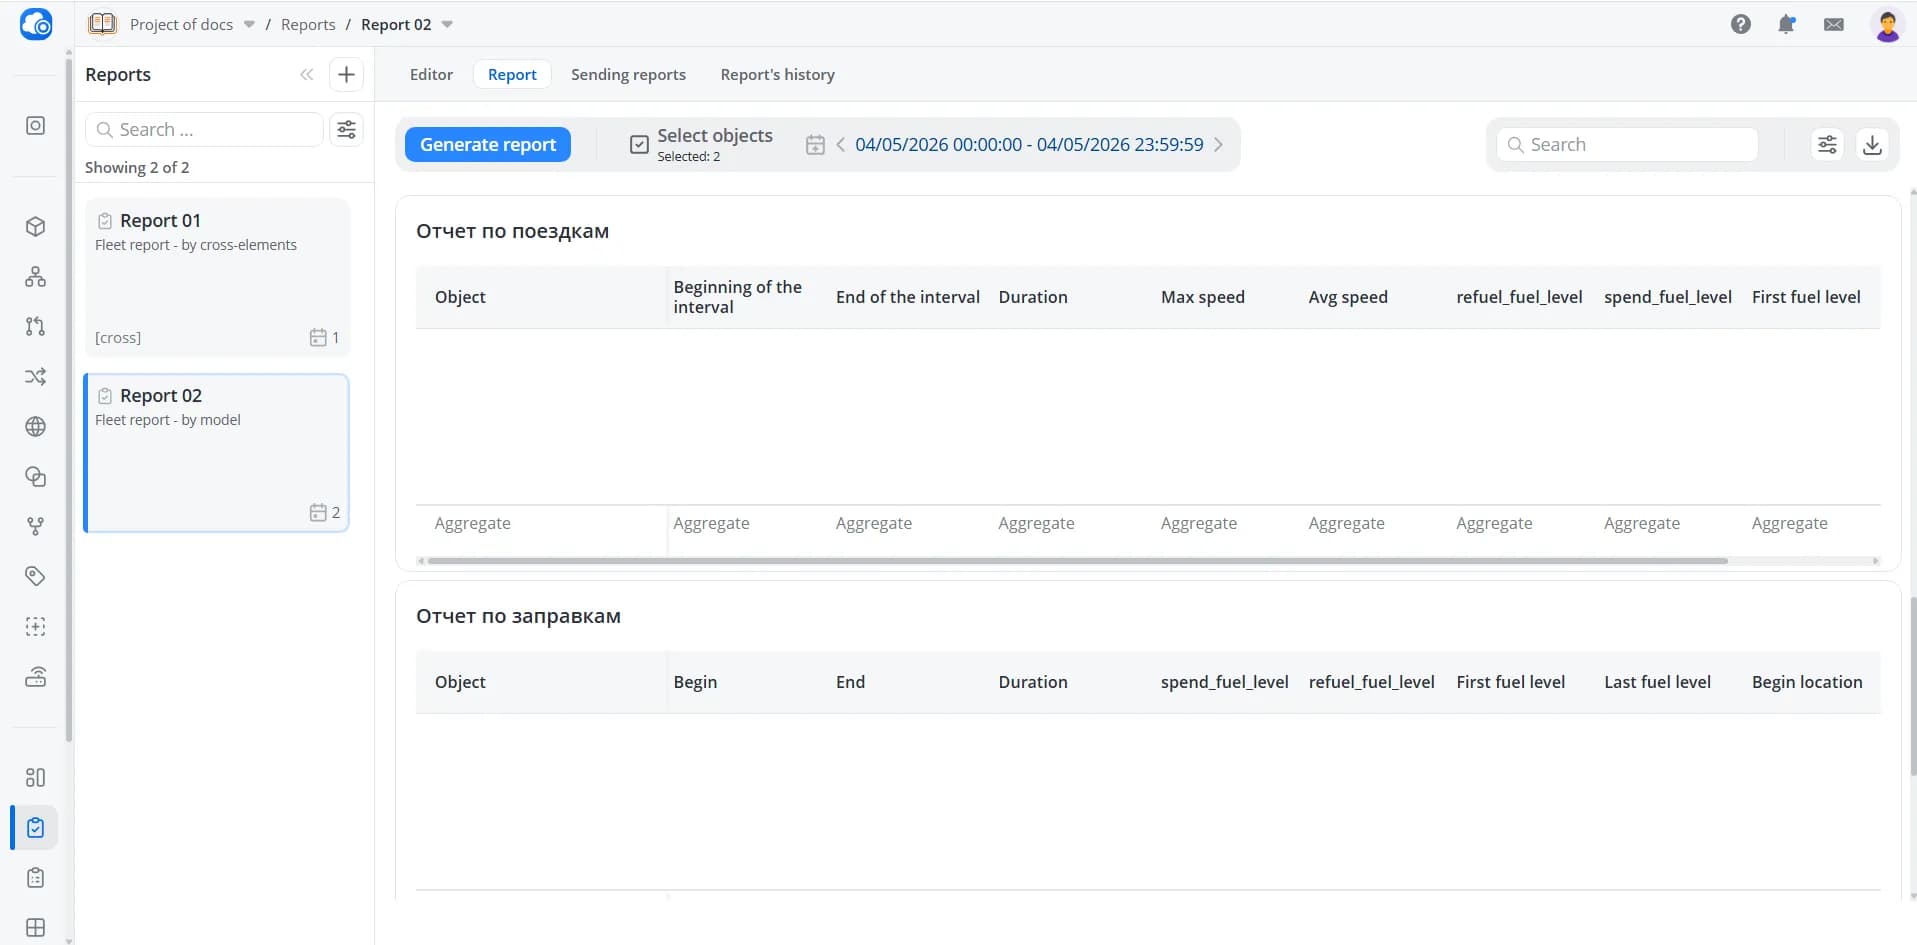
If there is no data or no events available for a particular table during the selected time range, that table will remain empty.
💡
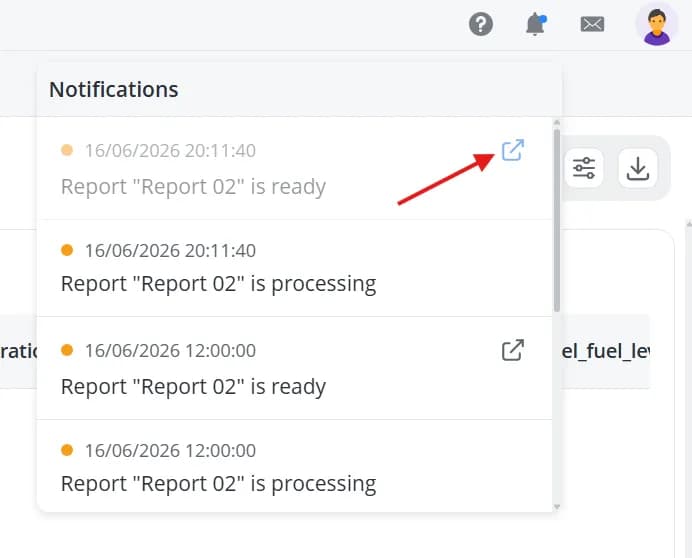
Notifications will inform you about each stage of report generation. Once the report is ready, you can use the shortcut
button to open it directly.
Customizing the report appearance
Hover over a column name to see the current sort order. Click it to change the sorting.
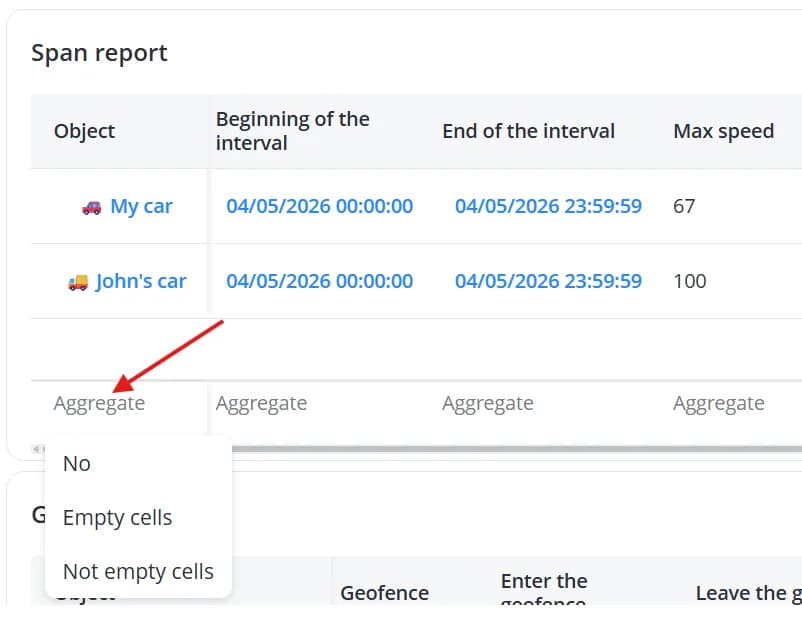
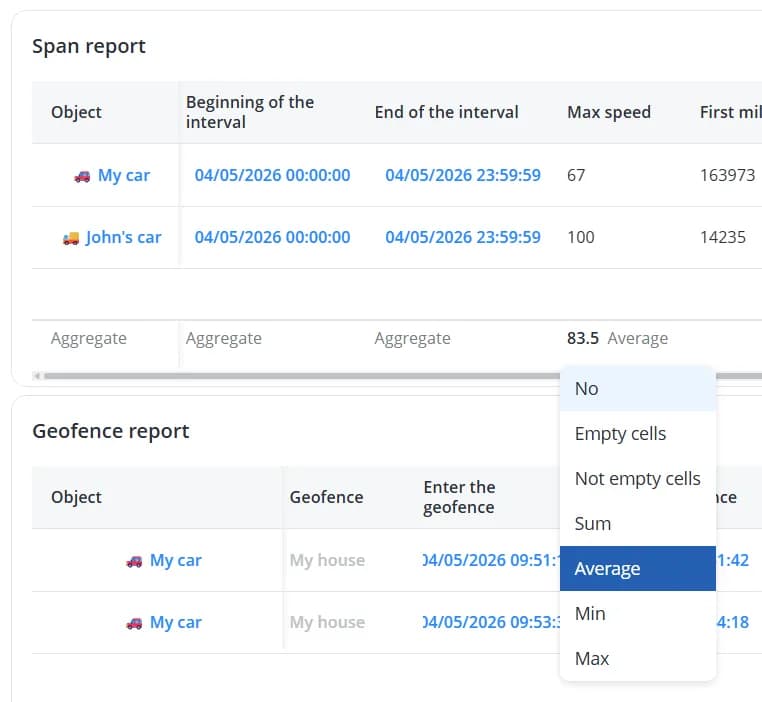
Click Aggregate to count the number of empty or populated cells in columns containing string data.
For columns containing numeric data, you can also calculate the sum, average value, minimum, or maximum.
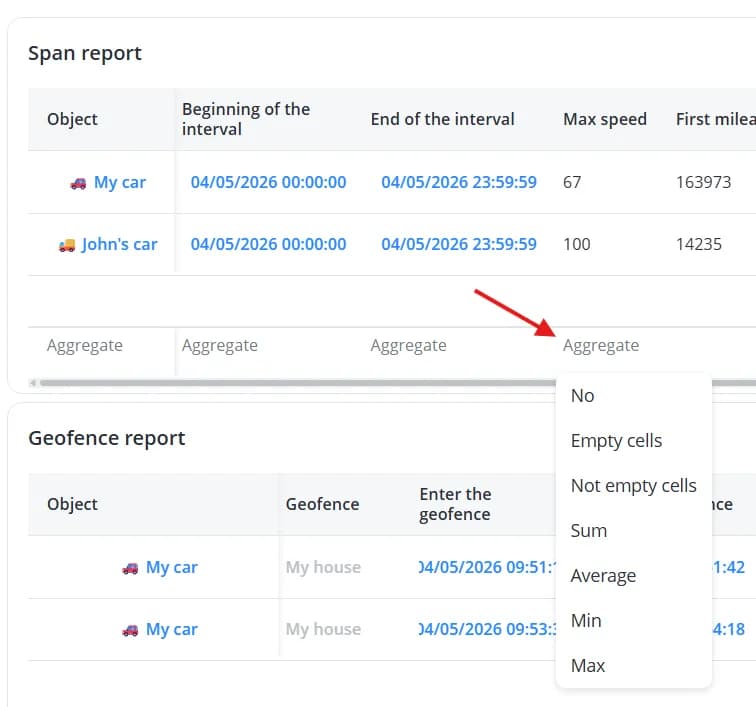
If you no longer need calculations for a particular column, click the calculated value and select No.
You may also want to rearrange, edit, or delete tables. To do this, return to the Editor tab. The generated report
data will remain available, allowing you to adjust the report layout while viewing the table contents.
When you hover over a table, additional table management options appear in the upper-right corner.
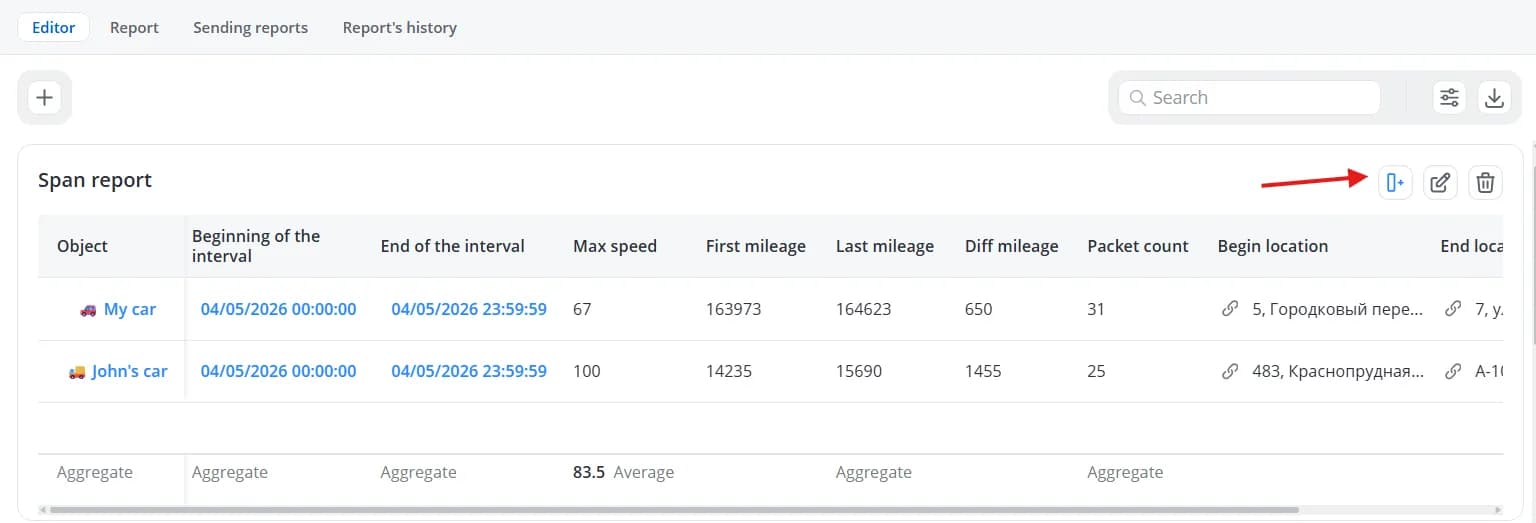
- Add another report next to it – adds another table to the right of the selected table. After clicking the button, choose which table should be added;

When two tables are placed side by side, each table displays a Move this report down button.
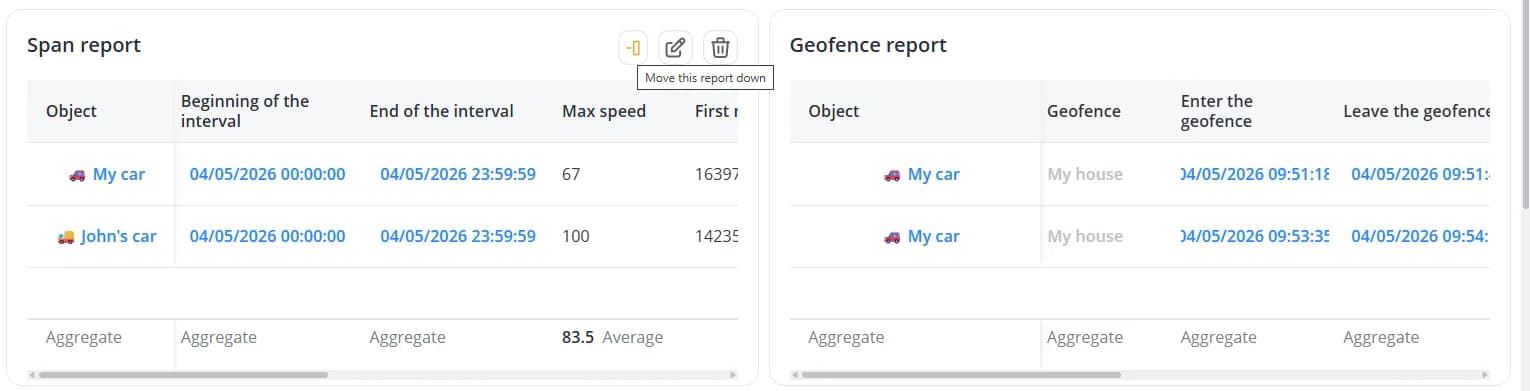
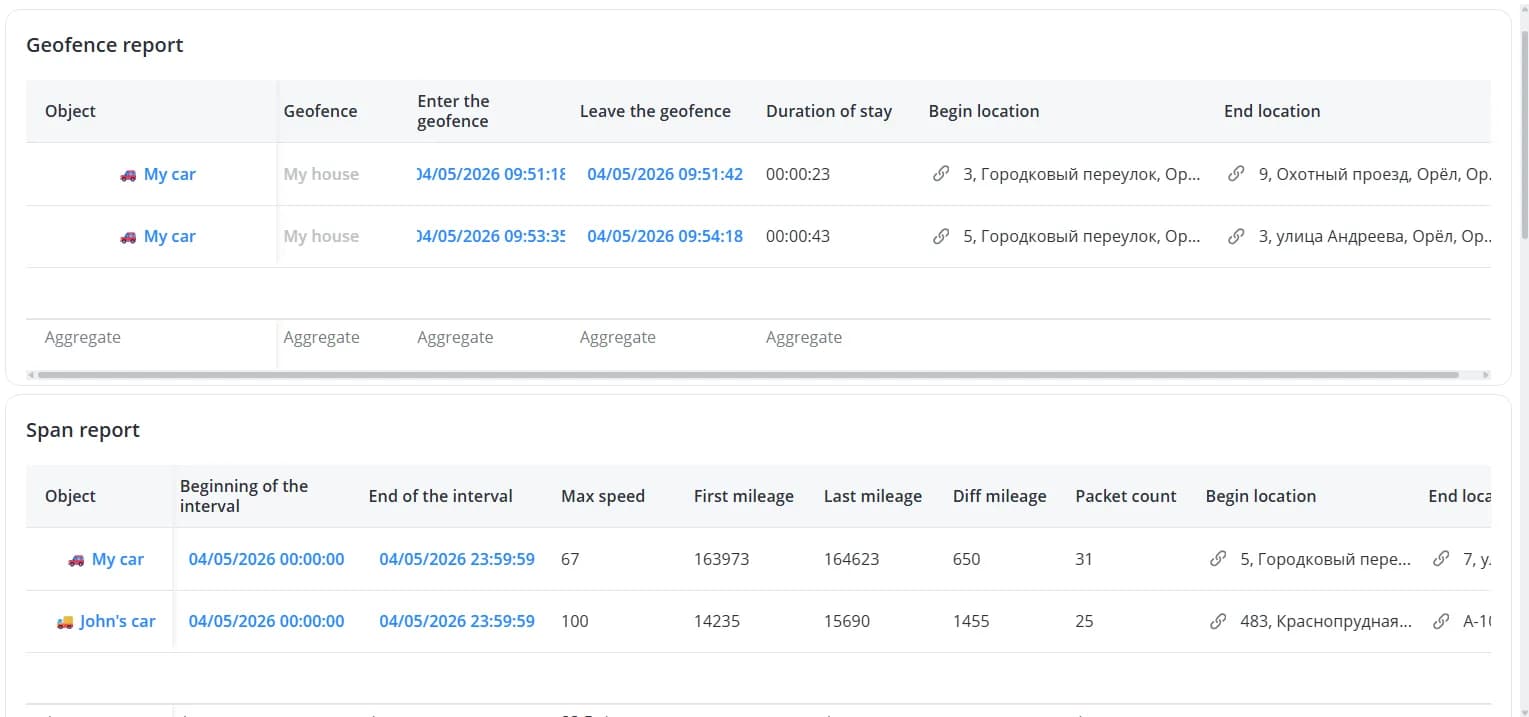
By combining Add another report next to it and Move this report down, you can rearrange the table layout.
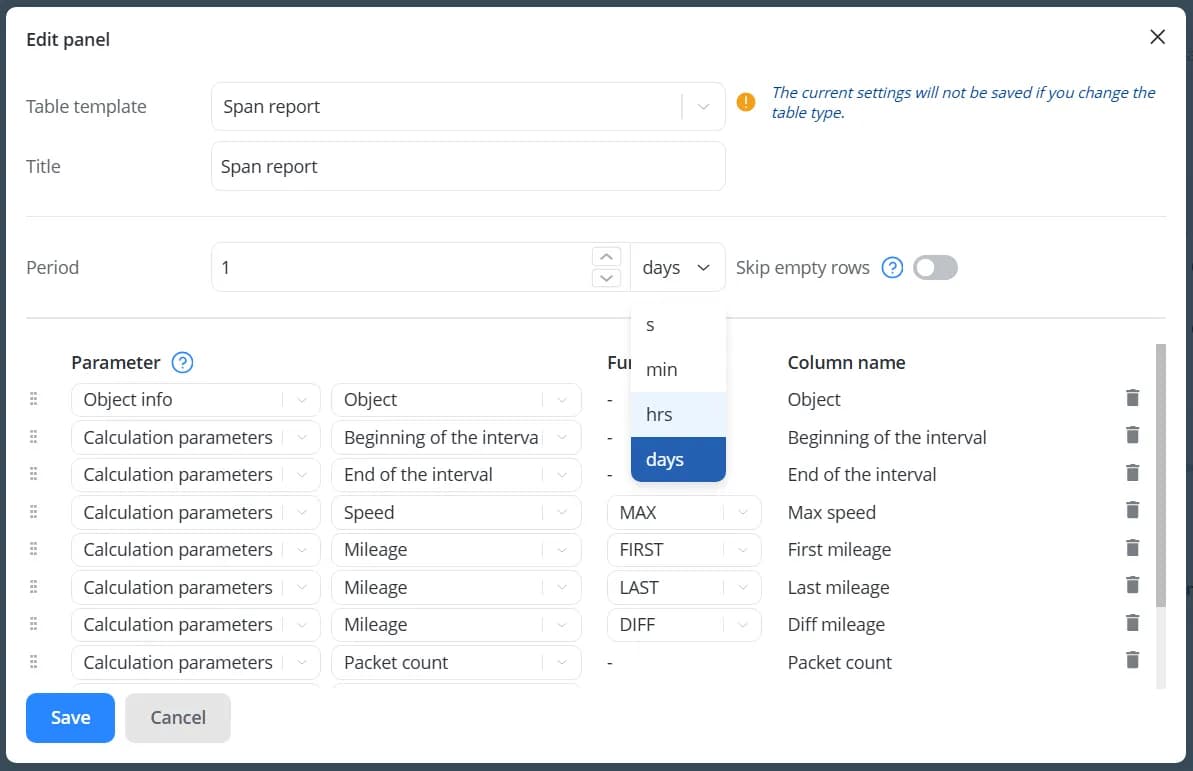
- Edit – edit the selected table. Clicking this option opens the table settings form, where you can configure its properties and columns;
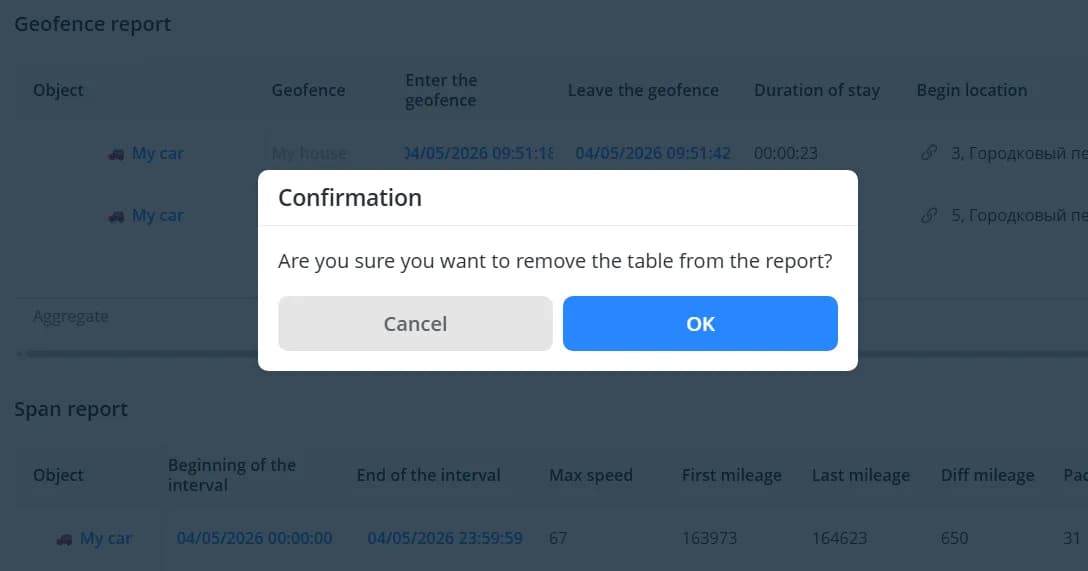
- Delete – remove the selected table. A confirmation dialog will appear before deletion.
To change a table's height, drag its bottom border.
You can also resize tables placed side by side by dragging the vertical divider between them.

💡
You can also rearrange and resize tables directly from the Report tab.